
DEXA Scan Body Fat Results: How to Read Them
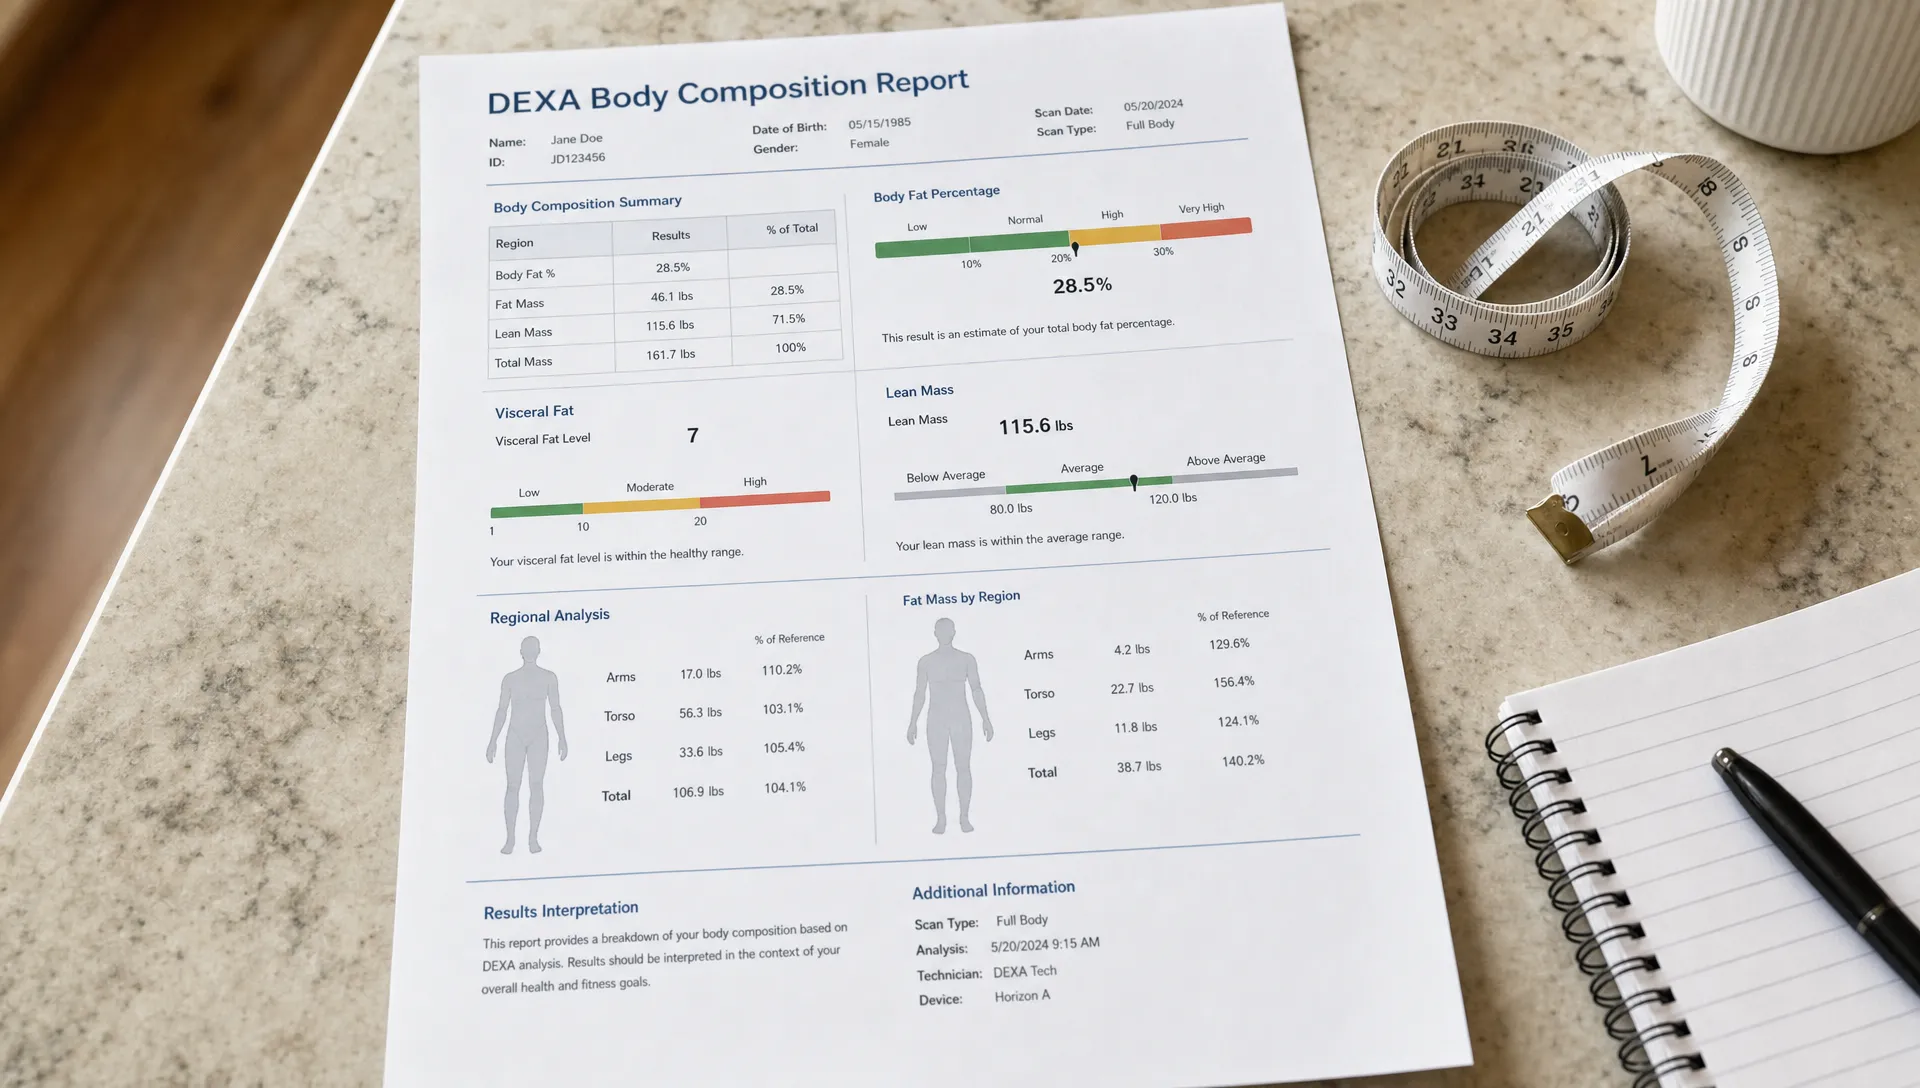
Your DEXA scan body fat results can feel both empowering and confusing. You finally have precise data, but the report may include body fat percentage, fat mass, lean mass, visceral fat, regional breakdowns, asymmetry, bone metrics, and estimated metabolic numbers all at once.
The best way to read a DEXA report is not to hunt for one perfect score. It is to understand what each metric tells you, how the numbers relate to each other, and which ones matter most for your goal.
Below is a practical guide to interpreting your DEXA scan body fat results so you can turn the report into better decisions about training, nutrition, and long-term health.
Start with the big picture, not just body fat percentage
A DEXA scan, also written as DXA, uses low-dose X-ray technology to estimate how your body mass is divided into fat tissue, lean soft tissue, and bone mineral content. That makes it far more useful than a bathroom scale, which only tells you total weight.
Before you focus on whether your body fat percentage is good or bad, scan the report for the major categories. Most body composition reports include some version of the following metrics.
| Metric | What it means | Why it matters |
|---|---|---|
| Total body fat percentage | The share of your total body mass that is fat | Useful for a high-level view of body composition |
| Fat mass | The total amount of fat tissue, usually in pounds or kilograms | Helps you see actual fat gained or lost over time |
| Lean mass | Non-fat, non-bone tissue, including muscle, organs, water, and glycogen | Helps you track whether weight changes are coming from lean tissue |
| Visceral fat | Fat stored deep in the abdomen around internal organs | Important for metabolic health context |
| Regional composition | Fat and lean mass by area, such as arms, legs, and trunk | Reveals distribution patterns and training imbalances |
| Left vs. right comparison | Differences between sides of the body | Can highlight asymmetries relevant to performance or injury prevention |
| Bone mineral density | A measure related to bone strength | Useful for bone health screening and monitoring |
Think of your report as a map. Body fat percentage is the headline number, but the map becomes useful when you look at where fat is stored, how much lean mass you have, and whether the trend is moving in the right direction.
How to read your DEXA body fat percentage
Body fat percentage is calculated by dividing fat mass by total body mass. If someone weighs 180 pounds and has 45 pounds of fat mass, their body fat percentage is 25 percent.
That number is useful because it adjusts for body size. A 20-pound fat loss means something different for a 130-pound person than it does for a 230-pound person. Percentage gives you a standardized way to compare body composition across time.
Still, body fat percentage has limitations. It can go down because you lost fat, gained lean mass, or both. It can also stay the same even if meaningful changes happened in opposite directions. For example, losing 5 pounds of fat while losing 5 pounds of lean mass may produce a scale change, but not the kind of body composition improvement most people want.
If your main question is how much confidence to place in the number, DEXA is widely used because it provides a more detailed body composition analysis than consumer devices. For a deeper look at measurement reliability, DEXA SF has a separate guide on how accurate a DEXA scan is for body fat percentage.
A practical body fat percentage reference
Body fat ranges vary by sex, age, sport, medical history, and personal goals. The table below gives a broad fitness-oriented reference, not a medical diagnosis.
| General category | Men | Women | How to interpret it |
|---|---|---|---|
| Essential fat range | 2-5% | 10-13% | Minimum levels needed for normal physiological function |
| Athletic range | 6-13% | 14-20% | Common among highly trained individuals |
| Fitness range | 14-17% | 21-24% | Often associated with visibly lean body composition |
| General healthy range | 18-24% | 25-31% | Common range for many active adults |
| Higher body fat range | 25%+ | 32%+ | May be worth discussing in the context of health goals and other markers |
Use ranges as orientation, not judgment. A recreational runner, a strength athlete, a postmenopausal woman, and someone rebuilding after injury may all have different ideal targets. Your best target is the one that supports your health, energy, performance, and sustainability.
Read fat mass in pounds, not only percentages
Fat mass is one of the most important numbers on the report because it shows the actual amount of fat tissue estimated by the scan. If your report says you have 42 pounds of fat mass, that is the number to watch when your goal is fat loss.
This matters because percentages can be misleading during recomposition. Imagine your body fat percentage drops from 28 percent to 25 percent. That looks like progress, but you still need to check whether fat mass went down or lean mass went up. Ideally, fat loss goals involve a decrease in fat mass while lean mass is maintained or increased.
The reverse can also happen. If your weight goes down but your fat mass barely changes, much of the loss may be coming from lean tissue, water, or glycogen. That can happen with aggressive dieting, low protein intake, poor sleep, or a training plan that does not include enough resistance work.
When reading a follow-up DEXA scan, ask three questions:
- Did fat mass decrease, increase, or stay about the same?
- Did lean mass change in the same period?
- Did the change match what I expected based on my nutrition and training?
Those three questions are often more useful than asking whether the scale moved.
Pay attention to where fat is stored
Two people can have the same body fat percentage and very different health or performance profiles. One person may store more fat in the hips and legs. Another may store more fat around the abdomen. DEXA helps you see that distribution.
Most reports divide the body into regions such as arms, legs, trunk, android, and gynoid areas. The android region generally refers to the abdominal area, while the gynoid region includes the hips and upper thighs. A higher concentration of abdominal fat can be more relevant for metabolic health than the same amount of fat stored elsewhere.
Visceral fat is especially important. Unlike subcutaneous fat, which sits under the skin, visceral fat is stored deeper in the abdomen around internal organs. Higher visceral fat is associated with greater cardiometabolic risk, although your DEXA result should always be interpreted alongside blood pressure, blood lipids, glucose markers, waist measurement, family history, and clinician guidance.
If your report includes visceral fat, do not treat it as just another cosmetic metric. It is often one of the most useful health-related numbers in the scan. For a deeper explanation, see DEXA SF's guide on what a DEXA scan for visceral fat can reveal.
Understand lean mass before judging your results
Lean mass is often described as muscle, but that is only partly true. DEXA lean mass includes skeletal muscle, organs, connective tissue, water, and stored glycogen. It is a very useful metric, but it is not a direct muscle biopsy.
This distinction matters when interpreting short-term changes. A big jump in lean mass after a week of high-carbohydrate eating may reflect more glycogen and water, not several pounds of new muscle. A drop after travel, dehydration, or a low-carb phase may not mean you lost actual contractile tissue.
The most useful lean mass patterns are seen over time. If you are resistance training and eating enough protein, your goal may be to maintain or gradually increase lean mass while reducing fat mass. If you are intentionally gaining, you may expect lean mass to rise, but you will also want to watch how much fat mass increases with it.
Regional lean mass is especially helpful. If your leg lean mass is increasing during a lower-body strength block, that supports the idea that training is producing a measurable adaptation. If your trunk or appendicular lean mass is declining during weight loss, it may be a sign to revisit calories, protein, recovery, or training intensity.
For strength-focused clients, the body fat percentage is only one piece of the story. DEXA can also help clarify whether training is translating into measurable tissue changes, which is why many lifters use it to track muscle mass progress over time.
Look for left vs. right asymmetry
One advantage of a DEXA body composition report is that it can show differences between the left and right sides of the body. These asymmetries are common. Most people have a dominant side, and sports like tennis, golf, baseball, soccer, or cycling can create side-to-side differences over time.
A small asymmetry is not automatically a problem. The key is context. If you have a history of injury, pain, or performance differences, a noticeable left-right gap in lean mass may be useful information to share with a qualified coach, physical therapist, or clinician.
For example, if your right leg has meaningfully more lean mass than your left leg after a prior left knee injury, the scan may support what you already feel during training. It does not diagnose the injury, but it can help guide better questions. Are you loading both sides evenly? Are you compensating during squats or lunges? Does your rehab plan need more unilateral work?
Asymmetry is most useful when tracked over time. One scan gives a snapshot. Repeated scans under similar conditions can show whether the gap is shrinking, growing, or staying stable.
Do not ignore bone and metabolic metrics
Even if you scheduled the scan for body fat, your report may also include bone-related measurements. Bone mineral density is clinically important, especially for people with risk factors for low bone density, older adults, postmenopausal women, endurance athletes with low energy availability, and anyone with a history of fractures.
According to MedlinePlus, a T-score compares your bone density with that of a healthy young adult, while a Z-score compares it with what is expected for someone of your age, sex, weight, and ethnic or racial background. If your report flags low bone density or your results raise concerns, discuss them with a qualified healthcare professional.
Some DEXA reports also include estimated resting metabolic rate or similar metabolic insights. Treat these as estimates, not exact calorie prescriptions. They can be useful for planning nutrition, but your real-world intake, appetite, weight trend, training volume, sleep, and energy levels should all be considered.
Turn your DEXA results into a goal-specific plan
The value of a DEXA scan is not just precision. It is better decision-making. Different goals require different metrics.
| Goal | Metrics to prioritize | What progress may look like |
|---|---|---|
| Fat loss | Fat mass, body fat percentage, visceral fat, trunk fat | Fat mass decreases while lean mass is mostly maintained |
| Body recomposition | Fat mass, lean mass, regional lean mass | Fat mass decreases and lean mass stays stable or increases |
| Muscle gain | Lean mass, appendicular lean mass, regional changes | Lean mass rises with limited fat mass gain |
| Health improvement | Visceral fat, trunk fat, body fat percentage, bone metrics | Visceral fat and trunk fat trend down, bone status is monitored when relevant |
| Performance balance | Left-right lean mass, regional lean mass | Asymmetries improve or remain appropriate for the sport |
The most common mistake is using the wrong metric for the goal. If your goal is fat loss, do not celebrate weight loss alone. If your goal is strength, do not panic about a higher scale weight if lean mass is rising. If your goal is metabolic health, do not overlook visceral fat just because total body fat is changing slowly.
Compare DEXA results under consistent conditions
DEXA is precise, but your body is still dynamic. Hydration, recent exercise, carbohydrate intake, sodium intake, menstrual cycle phase, travel, and gastrointestinal contents can all influence body composition readings, especially lean mass estimates.
For cleaner comparisons, try to repeat scans under similar conditions. That may mean using the same facility, scanning at a similar time of day, following the same pre-scan instructions, and avoiding unusual training or eating patterns right before the scan.
Also avoid comparing a DEXA result directly to a smart scale, handheld device, or skinfold estimate. Those tools use different assumptions and can produce different numbers. If your smart scale says 22 percent and your DEXA says 27 percent, that does not automatically mean one specific scan is wrong. It means the methods are different. If you are deciding which number to use as your baseline, this article on why DEXA body fat measurement beats smart scales explains the difference in more detail.
How often should you repeat a DEXA scan?
For most fitness and body composition goals, repeating a DEXA scan every 8-12 weeks is a practical cadence. That gives your training and nutrition plan enough time to produce measurable changes while avoiding overreacting to normal short-term fluctuations.
If you are in a slower maintenance phase, scanning less often may be enough. If you are working toward a specific performance, weight loss, or recomposition goal, a more structured schedule can help you see whether the plan is working.
The key is to treat each scan as feedback, not a verdict. A result that is not moving the way you hoped is not a failure. It is information you can use to adjust calories, protein, training volume, recovery, sleep, or consistency.
Frequently Asked Questions
What is a good DEXA scan body fat result? A good result depends on your sex, age, health status, training background, and goal. Instead of chasing a universal ideal, compare your result with appropriate reference ranges and track whether your fat mass, lean mass, and visceral fat are moving in the right direction.
Why is my DEXA body fat percentage higher than my smart scale? Smart scales estimate body fat using bioelectrical impedance and equations, while DEXA estimates fat, lean tissue, and bone using imaging technology. The methods are different, so the numbers often differ. Use one method consistently for trend tracking.
Does lean mass mean muscle mass? Not exactly. Lean mass includes muscle, organs, water, connective tissue, and glycogen. It is still very useful for tracking training progress, but short-term changes can reflect fluid and glycogen shifts as well as muscle changes.
Can a DEXA scan show belly fat? Yes, many DEXA body composition reports include trunk fat, android fat, and visceral fat estimates. These numbers can help you understand abdominal fat distribution beyond what body weight or BMI can show.
How should I read my first DEXA report? Start with total body fat percentage, then check fat mass, lean mass, visceral fat, regional distribution, and asymmetry. Your first scan is a baseline. The most useful insights usually come when you compare future scans under similar conditions.
Make your DEXA results actionable
A DEXA report is most valuable when the numbers are explained in context. At DEXA SF, clients receive professional DEXA body composition scans in San Francisco with precise measurements of body fat, lean mass, bone density, visceral fat, asymmetries, and metabolic insights, along with expert interpretation and practical fitness and nutrition guidance.
If you want clearer data for your next phase of training, fat loss, or health improvement, you can schedule your scan through DEXA SF and use your results as a smarter baseline for what comes next.