
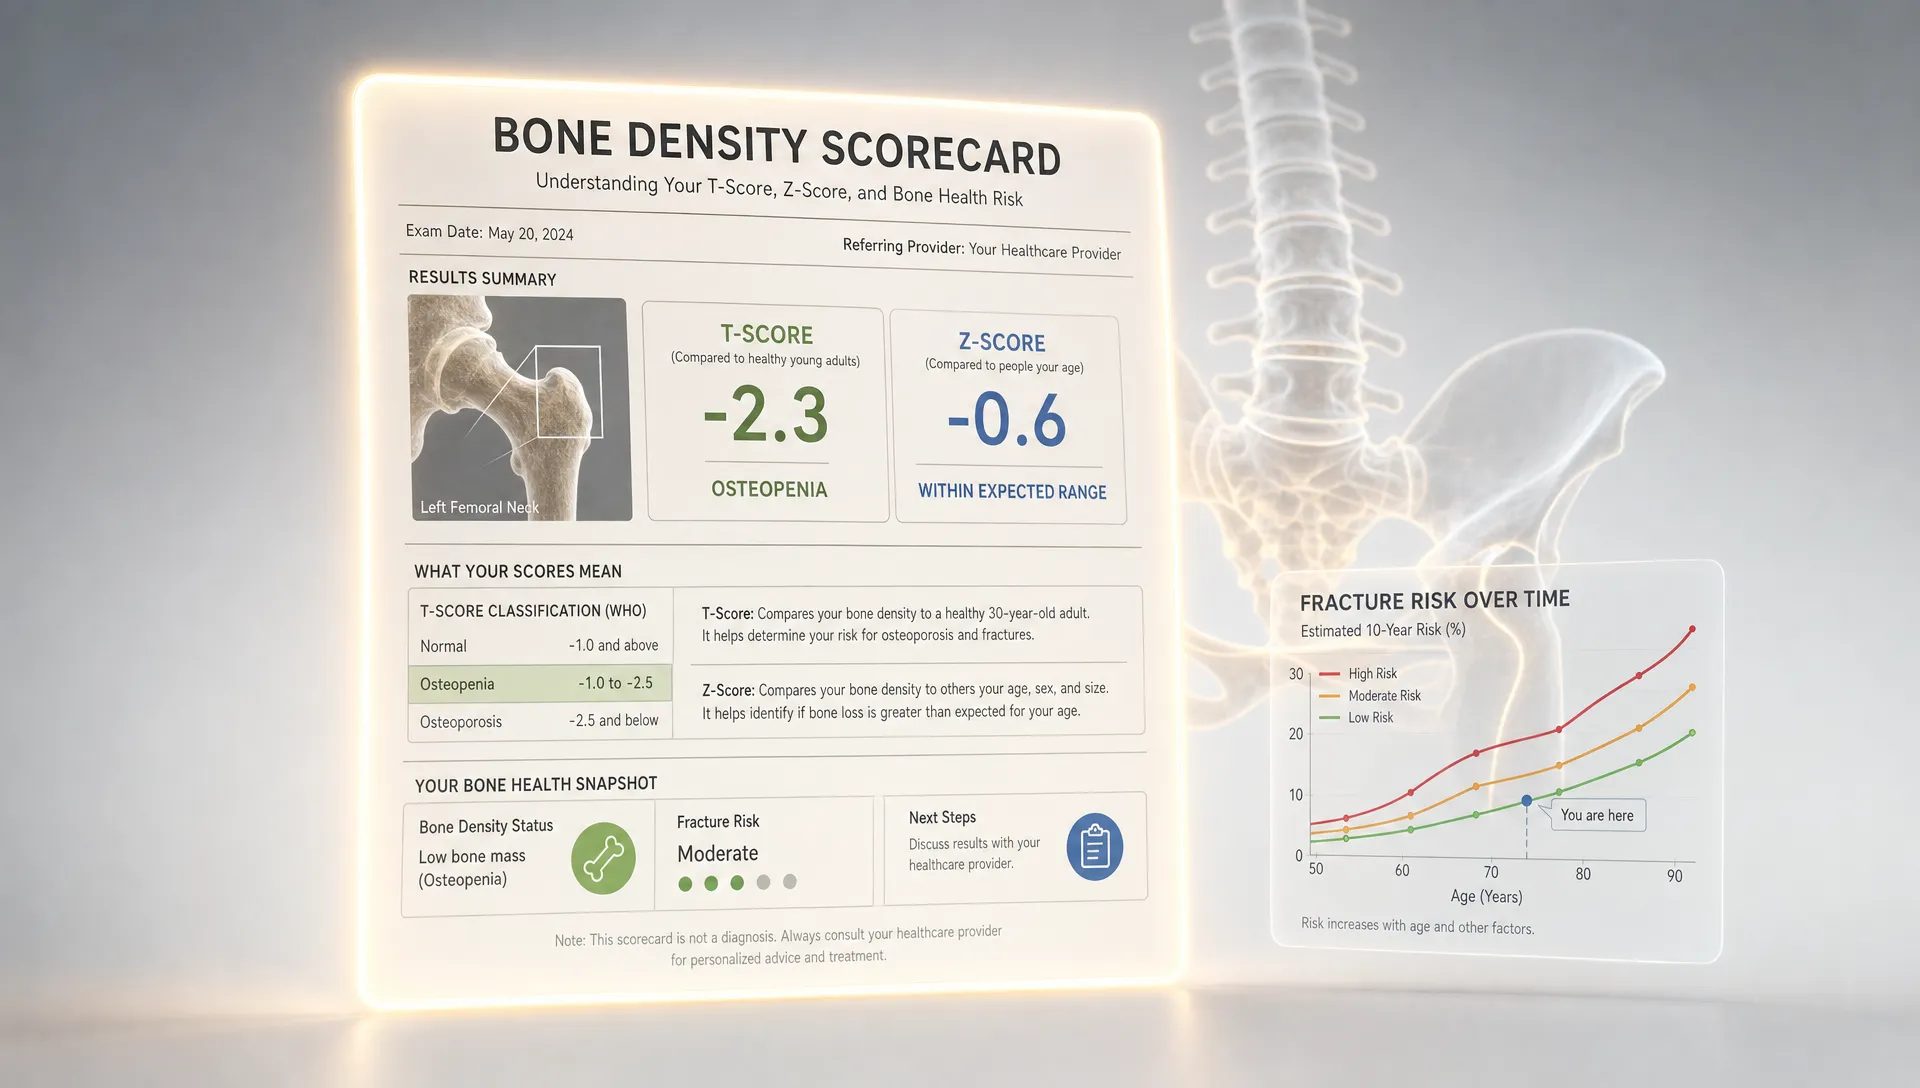
Bone Mineral Density Scan Results Made Simple
A bone mineral density scan result can look like a wall of medical abbreviations: BMD, BMC, T-score, Z-score, hip, spine, femoral neck. The good news is that you do not need to become a radiologist to understand the big picture.
At its core, a bone mineral density scan answers a practical question: how strong is your skeleton compared with expected reference ranges, and what should you do with that information? The result is not a pass-fail grade. It is a risk signal, a tracking tool, and a starting point for better decisions about training, nutrition, medical follow-up, and fracture prevention.
This guide breaks down the numbers in plain English so you can read your report with more confidence and ask better questions afterward.
What a bone mineral density scan actually measures
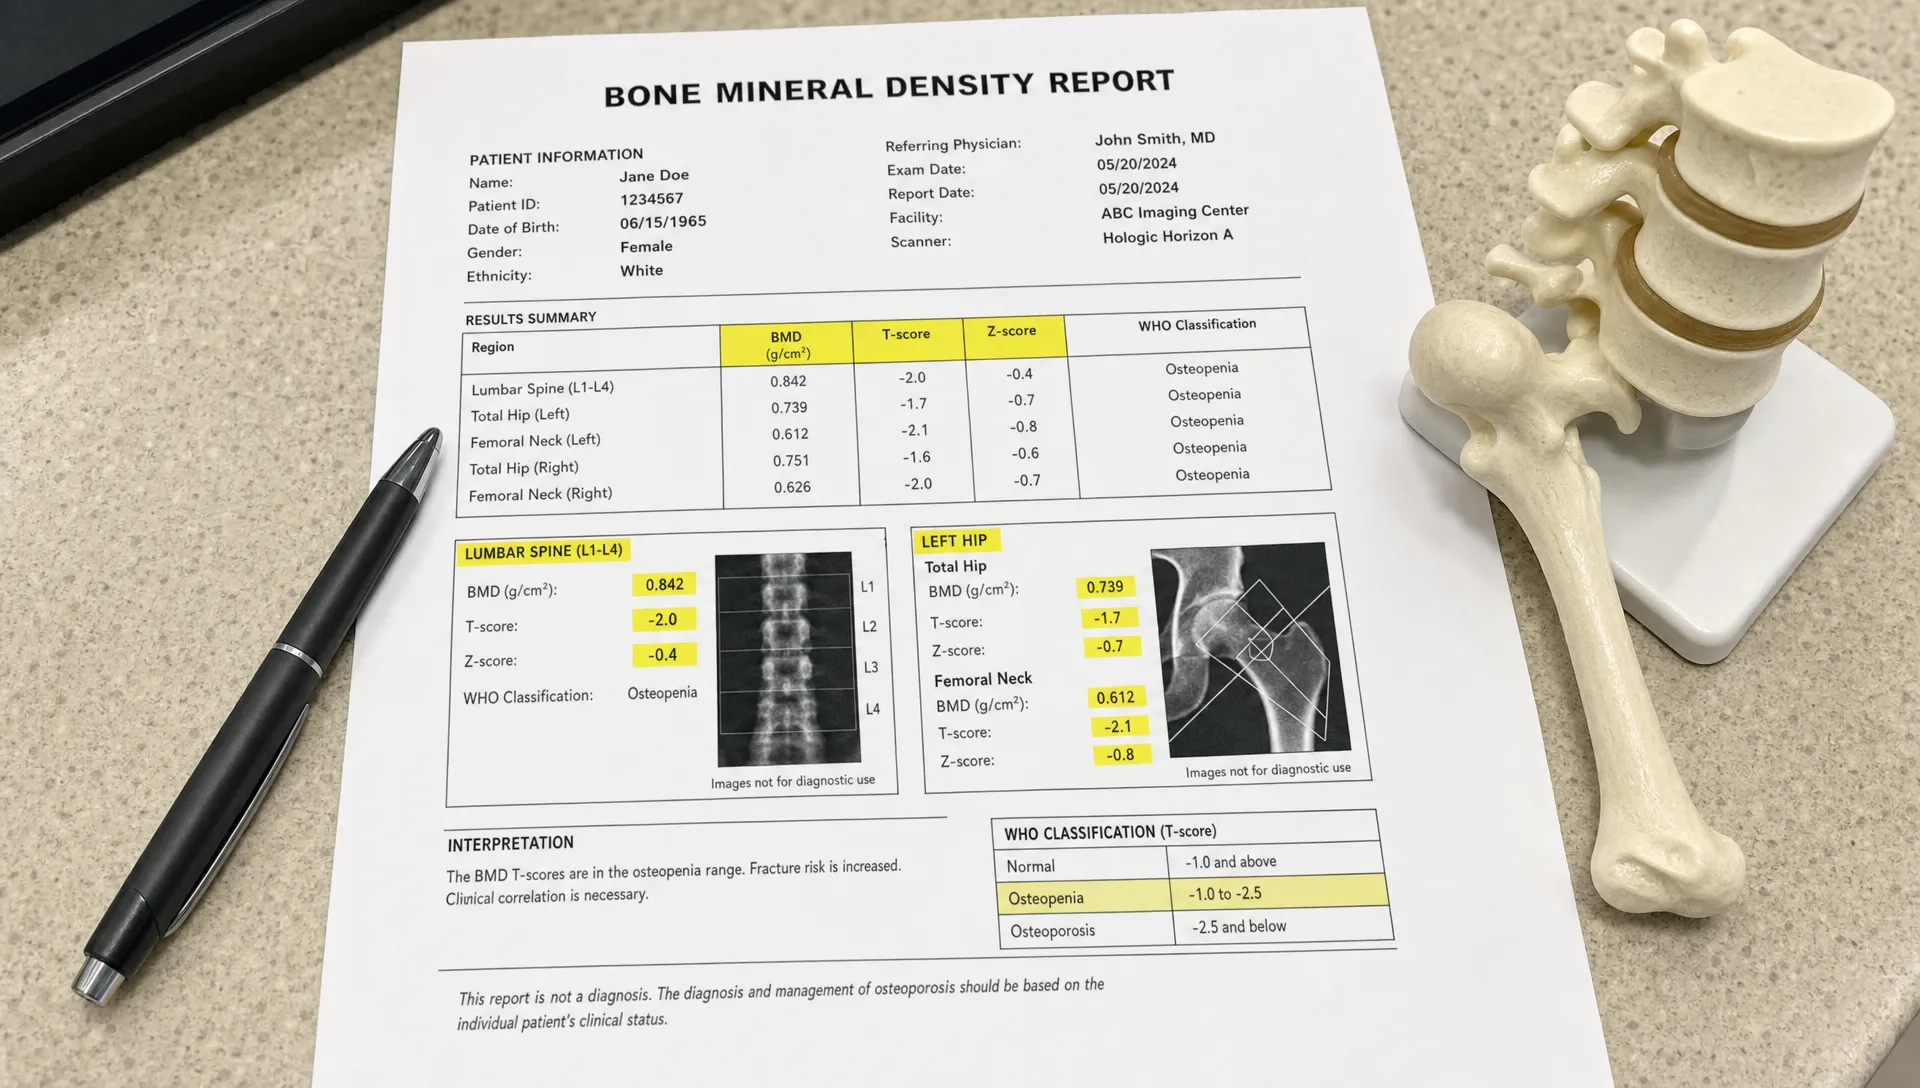
A bone mineral density scan, usually performed with DEXA or DXA technology, uses low-dose X-ray imaging to estimate how much mineral is present in specific bones. The most common measurement sites are the lumbar spine, total hip, and femoral neck, which is the narrow area near the top of the thigh bone.
Your report may include several measurements, but they are not all used the same way. Some describe the raw amount of mineral in bone. Others compare your result with a reference population. If you are still deciding whether to get tested or want a walkthrough of the appointment itself, DEXA SF has a separate guide on what to expect during a bone density scan.
The key is to understand which number answers which question.
| Result term | What it means | Simple interpretation |
|---|---|---|
| BMC | Bone mineral content, often reported in grams | The amount of mineral detected in the scanned bone area |
| BMD | Bone mineral density, usually reported in g/cm² | The density estimate used to compare bone strength over time and against reference ranges |
| T-score | Comparison with a healthy young adult reference group | Used most often to classify normal bone density, low bone mass, or osteoporosis in postmenopausal women and men age 50+ |
| Z-score | Comparison with people of similar age, sex, and other reference factors | Helps identify whether bone density is lower than expected for your age group |
If you want a deeper explanation of how BMC, BMD, T-scores, and Z-scores relate, this guide to bone mass numbers is a helpful companion.
T-score made simple
The T-score is the number most people notice first because it is commonly used to classify bone density status. It tells you how far your bone density is above or below the average bone density of a healthy young adult reference group, expressed in standard deviations.
A T-score of 0 means your result is about the same as that young adult reference average. A negative number means your bone density is lower than that reference average. The more negative the number, the lower the bone density.
The commonly used diagnostic categories are summarized by organizations such as the International Osteoporosis Foundation:
| T-score range | Category | What it generally means |
|---|---|---|
| -1.0 or higher | Normal bone density | Bone density is within the expected young adult range |
| Between -1.0 and -2.5 | Low bone mass, often called osteopenia | Bone density is below normal but not in the osteoporosis range |
| -2.5 or lower | Osteoporosis range | Bone density is low enough to meet the BMD criterion for osteoporosis at a valid diagnostic site |
Two details matter here. First, a T-score is site-specific. Your spine T-score and hip T-score may not match. Second, the number should be interpreted in context. A T-score of -2.4 and a T-score of -2.6 are close numerically, but they fall on different sides of a diagnostic threshold. That does not mean your bones suddenly changed at the cutoff. It means your result crossed a standardized classification line.
Z-score made simple
The Z-score compares your bone density with what is expected for someone closer to your own age and demographic reference group. This can be especially useful for younger adults, premenopausal women, and men under 50, where T-score-based diagnostic categories may not tell the full story.
According to the International Society for Clinical Densitometry official adult positions, a Z-score of -2.0 or lower is described as below the expected range for age. A Z-score above -2.0 is generally described as within the expected range for age.
A low Z-score does not automatically explain why bone density is low. It is more like a prompt to look for possible contributing factors, such as medication history, hormone changes, low energy availability, gastrointestinal conditions that affect nutrient absorption, or other medical causes. That follow-up belongs with a qualified healthcare professional.
Why the scan site matters
Bone density is not perfectly uniform across the body. Your lumbar spine, hip, and femoral neck can respond differently to aging, training, hormones, medications, and past injuries. That is why a report may show one site in the normal range and another in the low bone mass range.
The hip and femoral neck are especially important because hip fractures can have serious consequences, particularly later in life. The lumbar spine is also important, but it can sometimes be affected by arthritis, degenerative changes, calcifications, or surgical hardware that may make density appear higher than it truly is. This is one reason expert interpretation matters.
In practical terms, do not average everything in your head and assume that is your bone health score. Look at each site separately and ask which measurements are considered valid for interpretation.
Bone density is not the same as fracture risk
A bone mineral density scan gives powerful information, but it does not predict the future by itself. Fracture risk depends on more than density. Age, prior fractures, family history, smoking, alcohol intake, steroid medication use, balance, fall risk, vision, strength, and certain medical conditions can all matter.
This is why clinicians may combine BMD results with risk assessment tools such as FRAX, which estimates 10-year fracture probability using clinical risk factors, with or without femoral neck BMD.
Think of bone density like blood pressure. It is an important health marker, but it is not the whole person. A lower BMD result deserves attention, but the right next step depends on your full risk profile.
How to interpret changes over time
One scan gives you a baseline. Two or more scans can show direction, but only if you compare them carefully.
Small differences between scans may reflect measurement variation rather than true bone change. DEXA facilities use a concept called least significant change, which helps determine whether a difference is large enough to be considered meaningful. If your BMD changes by a tiny amount, it may not represent real improvement or decline.
For cleaner comparisons, try to use the same facility and scanner when possible. Also compare the actual BMD values, not only the T-scores, because reference databases and reporting formats can vary.
Good questions to ask when reviewing repeat results include:
- Is the change larger than the facility's least significant change?
- Were the same body sites measured both times?
- Were there changes in medications, training, weight, diet, hormones, or health status between scans?
- Does the report show a consistent trend, or just a small fluctuation?
How often you should repeat a scan depends on your age, risk factors, baseline result, and whether you are monitoring a treatment or major lifestyle change. If you are unsure about timing, this guide on when to get a bone DEXA scan explains common scenarios.
What your result may mean for next steps
Your result should lead to a plan, not panic. The plan will differ depending on your category, risk factors, and goals.
If your bone density is normal, the goal is maintenance. Resistance training, weight-bearing activity, adequate protein, calcium, vitamin D, sleep, and fall prevention all support long-term bone health. The NIH Office of Dietary Supplements provides evidence-based fact sheets on calcium and vitamin D if you want to understand intake recommendations and safety limits.
If your result shows low bone mass, also called osteopenia, the next step is usually risk refinement. Some people with osteopenia have relatively low fracture risk, while others may need closer monitoring or medical discussion because of age, prior fracture, medication use, or other factors.
If your result is in the osteoporosis range, it is worth discussing the report with a clinician who can evaluate fracture history, secondary causes, medication options, and prevention strategies. Lifestyle still matters, but medical treatment may also be appropriate for some people.
If your Z-score is unexpectedly low for your age, the priority is understanding why. That may involve a medical workup, especially if you are young, highly active, have a history of stress fractures, have irregular menstrual cycles, have digestive issues, or use medications known to affect bone.
Why body composition context can make the numbers more useful
Bone health is connected to the rest of your body. Muscle helps load bone. Nutrition affects both lean mass and skeletal remodeling. Very low body weight, rapid weight loss, or chronically low energy intake can work against bone maintenance. Visceral fat, training history, and left-right asymmetries can also shape the bigger health picture.
That is where DEXA can be especially useful: it can evaluate more than bone density. A professional DEXA scan can measure body fat, lean mass, visceral fat, asymmetries, bone-related metrics, and metabolic insights in one assessment. For active adults, athletes, people changing body composition, and anyone tracking long-term health, seeing body and bone health together can make the results easier to act on.
At DEXA SF, the value is not just the scan. It is also expert interpretation, plus fitness and nutrition guidance that helps you understand what the numbers mean for your real life.
Frequently Asked Questions
Is a bone mineral density scan the same as a DEXA scan? In most everyday health and fitness contexts, yes. DEXA or DXA is the technology commonly used to measure bone mineral density, especially at the hip and spine.
Does a low T-score mean I will fracture? Not necessarily. A low T-score means lower bone density, which is one important fracture risk factor. Actual fracture risk also depends on age, fall risk, prior fractures, medications, family history, and other health factors.
Is osteopenia the same as osteoporosis? No. Osteopenia, more accurately called low bone mass, means your T-score is below normal but not low enough to meet the osteoporosis BMD threshold. It still deserves attention because fracture risk can increase before osteoporosis is diagnosed.
Why are my spine and hip scores different? Different bones can lose or gain density at different rates. Training patterns, aging, arthritis, previous injuries, and scan artifacts can all affect site-specific results.
Can strength training improve bone density? Properly programmed resistance training and weight-bearing exercise can help maintain or improve bone strength over time, especially when paired with adequate nutrition. The right approach depends on your baseline bone density, injury history, and medical status.
How often should I repeat a bone mineral density scan? It depends on your result and risk profile. Some people need periodic monitoring, while others may not need another scan for a longer interval. If you are tracking treatment or meaningful lifestyle changes, ask whether the next scan should be timed to detect a meaningful change.
Turn your results into a clear plan
A bone mineral density scan result becomes more useful when you understand the numbers, compare them properly, and connect them to your training, nutrition, and health history.
If you are in San Francisco and want precise body composition and bone-related insights with expert interpretation, DEXA SF can help you move from confusing numbers to a clearer plan for your body, performance, and long-term health.