
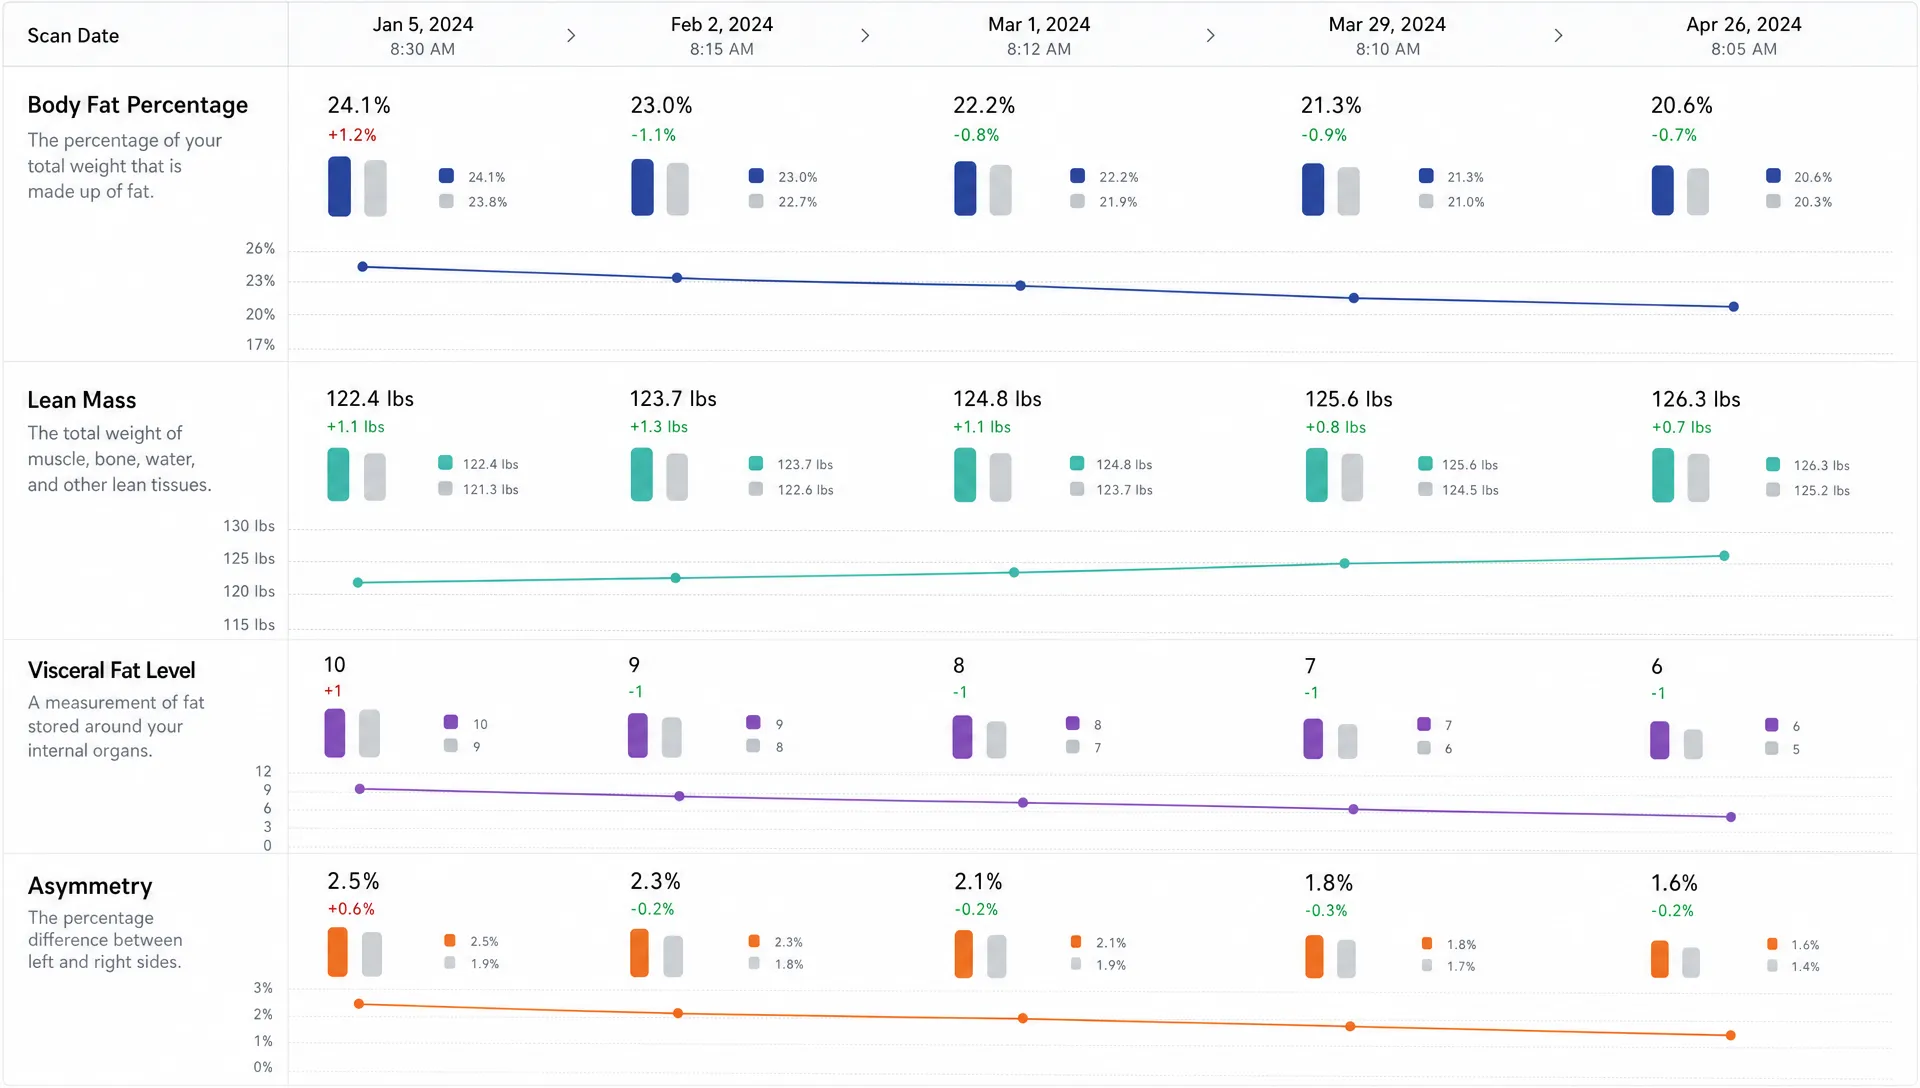
How to Compare DEXA Results Without Misreading Changes
A DEXA scan is most useful when it becomes a repeatable measurement system, not a one-time scorecard. The first scan gives you a baseline. The second, third and fourth scans tell you whether your training, nutrition or health plan is actually moving the right tissues in the right direction.
The challenge is that DEXA reports are dense. A small shift in body fat percentage might look dramatic, a gain in lean mass might be mostly hydration, and a regional change could reflect positioning rather than a true difference. Good DEXA scan body composition interpretation means comparing results with context, not reacting to every number on the page.
This guide focuses on how to compare DEXA results over time without misreading normal variation, scan conditions or metric relationships.
Start With the Same Question Every Time
Before comparing two reports, ask: what outcome were you trying to change?
A fat loss goal is not judged the same way as a muscle gain goal. A recomposition phase, where fat decreases while lean mass increases, needs a different lens than a bone health follow-up. If you do not define the goal first, it is easy to overfocus on whichever number changed the most.
For most people, repeat DEXA results are used to answer one of four questions:
- Did total fat mass go down?
- Did lean mass go up, stay stable or decline?
- Did visceral fat improve?
- Did regional balance or asymmetry change in a meaningful way?
Body fat percentage is useful, but it should not be the only metric you compare. It is a ratio, which means it can move because fat changed, lean mass changed or both changed at the same time. If your body fat percentage drops from 28 percent to 25 percent, that might reflect fat loss, muscle gain or a mix of both. The underlying pounds or kilograms matter.
If you need a refresher on what each field in a report means, DEXA SF has a separate guide to DEXA scan interpretation and understanding your report. For repeat scans, the bigger question is not just what each number means, but whether the change is real enough to act on.
Compare Absolute Tissue Changes, Not Just Percentages
The most common mistake is celebrating or worrying about body fat percentage without checking fat mass and lean mass.
Imagine two people both move from 30 percent to 27 percent body fat. One lost 7 pounds of fat and preserved lean mass. The other lost 3 pounds of fat and 4 pounds of lean mass. The percentage improved in both cases, but the first result is much healthier and more aligned with most fitness goals.
When comparing DEXA scans, review these numbers together:
| Metric | What it tells you | How to avoid misreading it |
|---|---|---|
| Body fat percentage | The share of total mass estimated as fat | Check fat mass and lean mass to see why the percentage changed |
| Total fat mass | Estimated pounds or kilograms of fat tissue | Compare it with weight change and regional fat changes |
| Lean mass | Non-fat, non-bone soft tissue, including muscle and body water | Interpret alongside hydration, training status and recent carbohydrate intake |
| Visceral fat | Fat stored around abdominal organs | Track direction over time rather than overreacting to tiny scan-to-scan changes |
| Regional lean mass | Lean tissue by arms, legs and trunk | Check for symmetry, training relevance and positioning consistency |
| Bone mineral density | Bone density estimate, often tracked for bone health | Follow clinical guidance and compare using consistent testing protocols |
A practical comparison starts with absolute changes, then moves to percentages. Ask: how many pounds of fat did I lose or gain? How many pounds of lean mass changed? Did total body weight move in a way that supports the DEXA result?
If weight stayed the same but fat mass decreased and lean mass increased, that is classic body recomposition. If weight dropped quickly and both fat and lean mass dropped, the plan may be too aggressive or protein and resistance training may need attention.
Standardize Scan Conditions Before Drawing Conclusions
DEXA is one of the most useful tools available for body composition tracking, but repeatability depends on testing conditions. If your first scan was done after a heavy dinner and your second was done after a morning fast, some differences may reflect food mass, hydration and glycogen rather than true tissue change.
For cleaner comparisons, try to keep these conditions consistent:
- Scan at a similar time of day
- Use the same facility and scanner when possible
- Wear similar light clothing without metal
- Keep pre-scan meals, fluids and exercise similar
- Avoid comparing a dehydrated scan with a fully hydrated scan
- Note recent hard training, travel, illness or unusually high sodium intake
This matters most when the change is small. A major shift over several months is usually easier to interpret than a tiny change over two weeks. The shorter the interval and the smaller the difference, the more careful you should be.
The International Society for Clinical Densitometry emphasizes the importance of facility-specific precision and least significant change for follow-up DXA testing, especially in bone density monitoring. The same principle is useful for body composition: repeat scans are most valuable when performed and interpreted consistently. You can review the ISCD's clinical DXA positions on its official positions page.
Know the Difference Between Real Change and Measurement Noise
Every measurement tool has some degree of variability. DEXA is highly informative, but it is not magic. Small changes can occur because of positioning, tissue hydration, machine calibration, analysis software or normal biological variation.
That does not make the scan unreliable. It means you should interpret changes in tiers.
A large change that matches your scale trend, waist measurement, training log and nutrition pattern is more likely to be meaningful. A tiny change that conflicts with every other signal should be treated cautiously until you have more data.
For example, a person who has trained consistently for 16 weeks, gained strength, maintained body weight and shows a meaningful increase in appendicular lean mass likely has a real training response. A person who sees a small lean mass increase after a single week of high carbohydrate intake may be seeing more glycogen and water, not new muscle tissue.
Use this simple framework:
| Type of change | How to interpret it |
|---|---|
| Large change across several metrics | More likely to be real, especially if it matches your behavior and other measurements |
| Small change in one isolated metric | Treat as a signal to watch, not proof of progress or failure |
| Change that conflicts with scale, waist and training data | Recheck scan conditions and compare again at the next interval |
| Repeated trend across multiple scans | Stronger evidence than any single comparison |
The goal is not to distrust the report. The goal is to avoid making big decisions from a change that may not be large enough to matter.
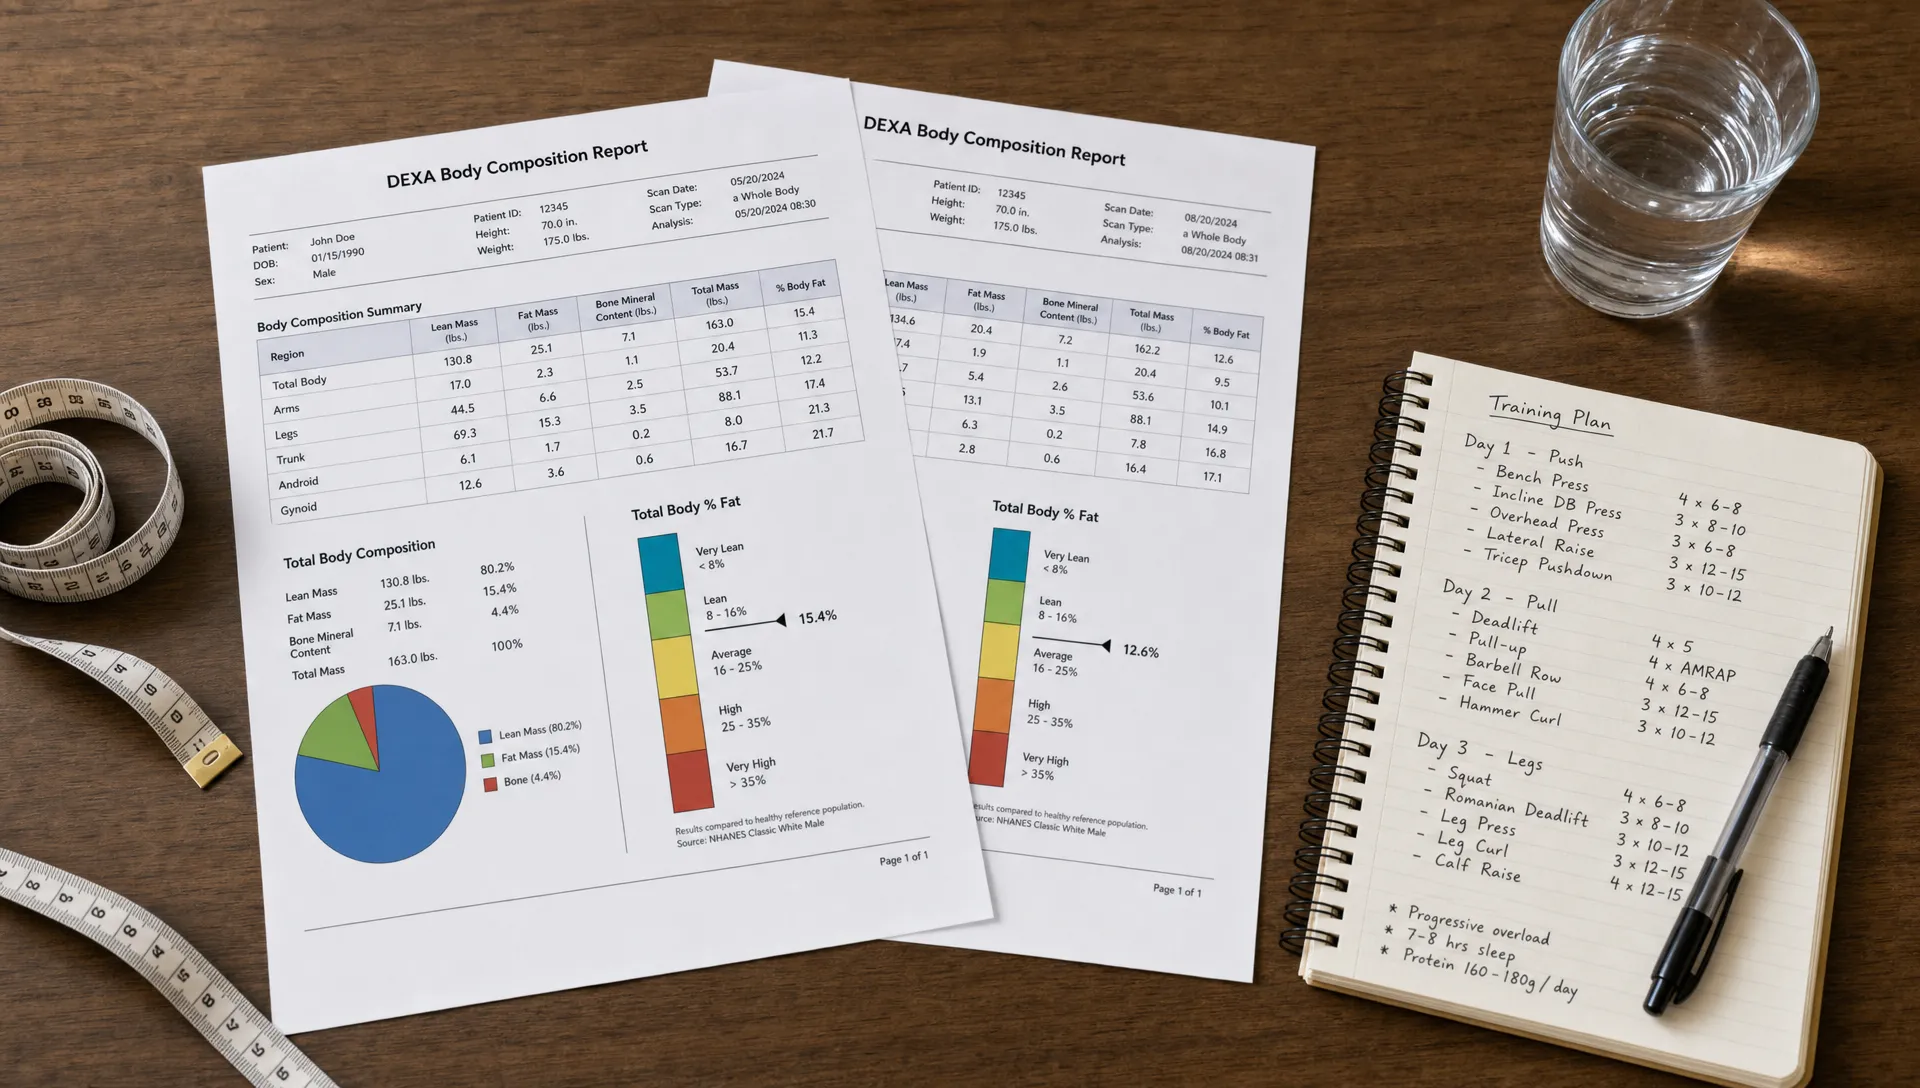
Put Body Fat Percentage in Context
Body fat percentage is often the headline number, but it is also the easiest to misunderstand.
Because it is calculated relative to total mass, body fat percentage can improve even when fat mass barely changes. If you gain lean mass while fat mass stays stable, your body fat percentage may decrease. That can be a positive result, especially during a muscle-building phase, but it is not the same as fat loss.
The opposite can also happen. If you lose lean mass during a strict diet, your body fat percentage may not improve as much as expected even if fat mass drops. This is why comparing DEXA body composition results requires a tissue-by-tissue review.
A better sequence is:
- Check total weight change.
- Check total fat mass change.
- Check lean mass change.
- Then interpret body fat percentage.
This order prevents the percentage from dominating the story. If your main goal is fat loss, total fat mass and visceral fat trends are usually more actionable than body fat percentage alone. If your main goal is performance or strength, lean mass distribution and regional changes may deserve more attention.
For a deeper breakdown of which body composition numbers deserve the most attention, see DEXA SF's guide to the DEXA body composition metrics that matter most.
Be Careful With Lean Mass Changes
Lean mass is one of the most valuable DEXA outputs, but it is not a direct measurement of muscle protein alone. DEXA estimates lean soft tissue, which includes muscle plus water and other non-fat tissue. That is why lean mass can change faster than true muscle can be built or lost.
Recent resistance training, inflammation from soreness, creatine use, carbohydrate intake, hydration and menstrual cycle phase can all influence body water. Since glycogen is stored with water, a higher carbohydrate period before one scan can make lean mass look better than a lower carbohydrate period before another.
This does not mean lean mass data should be ignored. It means your interpretation should match the timeline.
If lean mass rises gradually across months and aligns with improved strength, consistent lifting and adequate nutrition, it is more likely to reflect true progress. If lean mass jumps sharply between two scans taken close together, check whether the scan conditions changed.
Regional lean mass can be especially useful. If your leg lean mass improves during a lower body training block, or one side begins catching up after rehab-focused work, that pattern may be meaningful. DEXA SF covers this topic in more detail in its article on how a DEXA scan tracks muscle mass progress.
Do Not Overreact to Regional Differences
DEXA can show fat and lean mass by region, including arms, legs and trunk. This is helpful for spotting asymmetries and understanding where changes are happening, but regional data should be interpreted with extra care.
A left-right difference may reflect true dominance, sport-specific loading, injury history or training imbalance. It can also be influenced by positioning. If your arms or legs are placed differently from one scan to the next, small regional differences may appear larger than they are.
Look for patterns that repeat. A consistent left-right leg difference across multiple scans is more meaningful than a one-time discrepancy. A regional change that matches your training history is also more credible. For example, if you return from a right knee injury and your right leg lean mass remains lower across repeated scans, that may support a targeted strength plan.
Regional fat changes also need context. Many people want to know whether fat came off the abdomen, hips or legs. DEXA can help show distribution, but you cannot control fat loss from one region with a specific exercise. If abdominal fat decreases during a fat loss phase, that is useful information. If it does not move much after one short interval, that does not mean your plan failed.
Track Visceral Fat as a Health-Relevant Trend
Visceral fat is one of the most important DEXA metrics because it estimates fat stored deep in the abdomen around internal organs. Higher visceral fat is associated with increased cardiometabolic risk, and reducing it is often a major health goal.
The National Heart, Lung, and Blood Institute notes that excess weight, especially around the waist, is linked with higher risk for conditions such as heart disease and type 2 diabetes. Waist measurements and imaging-based tools are different methods, but they point to the same practical idea: abdominal fat patterns matter for health.
When comparing visceral fat, focus on direction and consistency. If visceral fat trends downward over several scans, especially alongside improved waist measurement, nutrition habits and activity, that is a useful sign. If it changes slightly between two scans, avoid treating the difference as a complete health verdict.
Visceral fat also responds to broader behavior patterns, not just scale change. Sleep, alcohol intake, aerobic activity, resistance training and diet quality can all influence long-term cardiometabolic health. DEXA gives you a clearer measurement, but your interpretation still needs the full lifestyle picture.
Choose the Right Interval Between Scans
Scanning too often can make normal variation look like progress or failure. Scanning too rarely can leave you guessing for months.
The right interval depends on your goal. For many body composition goals, repeating a DEXA scan every 8 to 16 weeks gives enough time for meaningful change while still allowing you to adjust your plan. Shorter intervals can make sense for specific athletic, medical or coached programs, but they require a careful interpretation of small differences.
Consider longer intervals if your goal is bone density, since bone changes often take more time than body composition changes. If you are monitoring bone health for clinical reasons, follow your healthcare provider's recommendations.
The best comparison schedule is one you can repeat under similar conditions. A consistent quarterly scan is usually more useful than random scans after vacations, intense training blocks or stressful weeks.
Use Supporting Data Instead of Reading DEXA in Isolation
DEXA is powerful because it separates fat, lean tissue, bone and regional distribution. Still, it should not be the only piece of information you use.
To compare results well, pair your DEXA report with simple supporting data:
- Scale weight trend over several weeks
- Waist measurement taken the same way each time
- Strength or performance logs
- Training consistency
- Protein intake and calorie targets if tracked
- Sleep, stress and recovery notes
- Photos taken under similar lighting if useful for your goal
These inputs help explain the report. If DEXA shows lean mass down, your training log may reveal a month of missed workouts or a steep calorie deficit. If fat mass is unchanged but strength is up and lean mass is higher, you may be in a productive recomposition phase.
A scan tells you what changed. Your habits and performance data help explain why it changed.
Common Ways People Misread DEXA Changes
Most misinterpretations come from treating one number as the full story. DEXA results are interconnected, so a change in one metric often depends on another.
Here are common mistakes to avoid:
| Misreading | Better interpretation |
|---|---|
| “My body fat percentage dropped, so I definitely lost fat.” | Check whether fat mass decreased or lean mass increased. The percentage alone cannot tell you which happened. |
| “My lean mass went up in two weeks, so I gained several pounds of muscle.” | Some short-term lean mass change may reflect water, glycogen or inflammation. Look for multi-month trends. |
| “One side is smaller, so I have a serious imbalance.” | Confirm the asymmetry across repeat scans and consider injury history, sport demands and positioning. |
| “My visceral fat barely changed, so nothing worked.” | Visceral fat should be tracked as a trend. Short intervals may not show the full effect of behavior change. |
| “The scan changed slightly, so I need a new plan immediately.” | Small isolated changes may not be actionable. Use the next scan and supporting data before making major changes. |
A single scan comparison can guide your next decision, but it should not create panic. The best use of DEXA is calm, repeatable tracking.
A Simple Step-by-Step Way to Compare Two DEXA Reports
When you receive a new report, use the same review process each time. This reduces emotional interpretation and keeps attention on the metrics that match your goal.
First, confirm that the scan conditions were similar. If they were not, make a note before comparing numbers. A report after a dehydrating endurance event should not be interpreted the same way as a report after a normal rest day.
Next, compare total body weight in the report with your home scale trend. They do not need to match exactly, but they should make sense together. If DEXA weight is very different from your usual weight, ask why before interpreting tissue changes.
Then look at fat mass, lean mass and body fat percentage together. Do not separate them. If fat mass went down and lean mass stayed stable, that is usually a strong fat loss result. If both went down, you may need to protect lean tissue. If lean mass went up and fat mass stayed stable, your training block may be working even if scale weight increased.
After that, review visceral fat and regional distribution. These metrics help refine your plan, but they should be interpreted after you understand the total-body picture.
Finally, decide what action, if any, the data supports. Sometimes the right action is to keep going. Not every scan needs a dramatic change in training or nutrition.
When to Ask for Expert Interpretation
A DEXA report becomes more useful when someone can connect the numbers to your goal, training phase and health context. This is especially true if you are comparing several scans, managing a plateau or seeing results that do not match your expectations.
Professional interpretation can help you understand whether a change is meaningful, which metrics deserve attention and how to adjust your plan without overcorrecting. At DEXA SF, clients receive professional DEXA body composition scans in San Francisco with precise measurements of body fat, lean mass, bone density, visceral fat, asymmetry and metabolic data, along with expert interpretation and practical fitness and nutrition guidance.
The scan is the measurement. The interpretation is what turns it into a better decision.
Frequently Asked Questions
How much change between DEXA scans is meaningful? It depends on the metric, scanner, facility precision and scan conditions. Large changes that repeat across fat mass, lean mass, scale trends and measurements are more meaningful than small isolated shifts. Ask your provider how they interpret least significant change for their equipment and process.
Can DEXA lean mass changes be water weight? Yes. DEXA lean mass includes lean soft tissue, which is influenced by hydration, glycogen, inflammation and recent training. Multi-month trends that match strength progress are more useful than short-term jumps.
Should I compare body fat percentage or fat mass? Compare both, but start with fat mass. Body fat percentage is a ratio, so it can change because fat mass changed, lean mass changed or both changed. Fat mass shows the absolute tissue change more directly.
How often should I get a DEXA scan to track progress? Many people use intervals of 8 to 16 weeks for body composition goals, depending on the plan and how quickly meaningful change is expected. Bone density monitoring may require a different timeline based on clinical guidance.
Can I compare DEXA results from different facilities? You can review the general direction, but comparisons are cleaner when scans are done on the same machine, at the same facility and under similar conditions. Different scanners, software and protocols can affect results.
Compare Your Next DEXA Scan With More Confidence
A DEXA scan can show whether your body is changing in the way your scale cannot. The key is to compare results with the right context: consistent scan conditions, absolute tissue changes, realistic timelines and expert interpretation.
If you want a clearer baseline or a more confident follow-up, DEXA SF provides professional body composition scans in San Francisco with precise results and guidance you can use. Schedule your scan through DEXA SF and make your next comparison easier to understand.