
DEXA Scan Interpretation: How to Understand Your Report
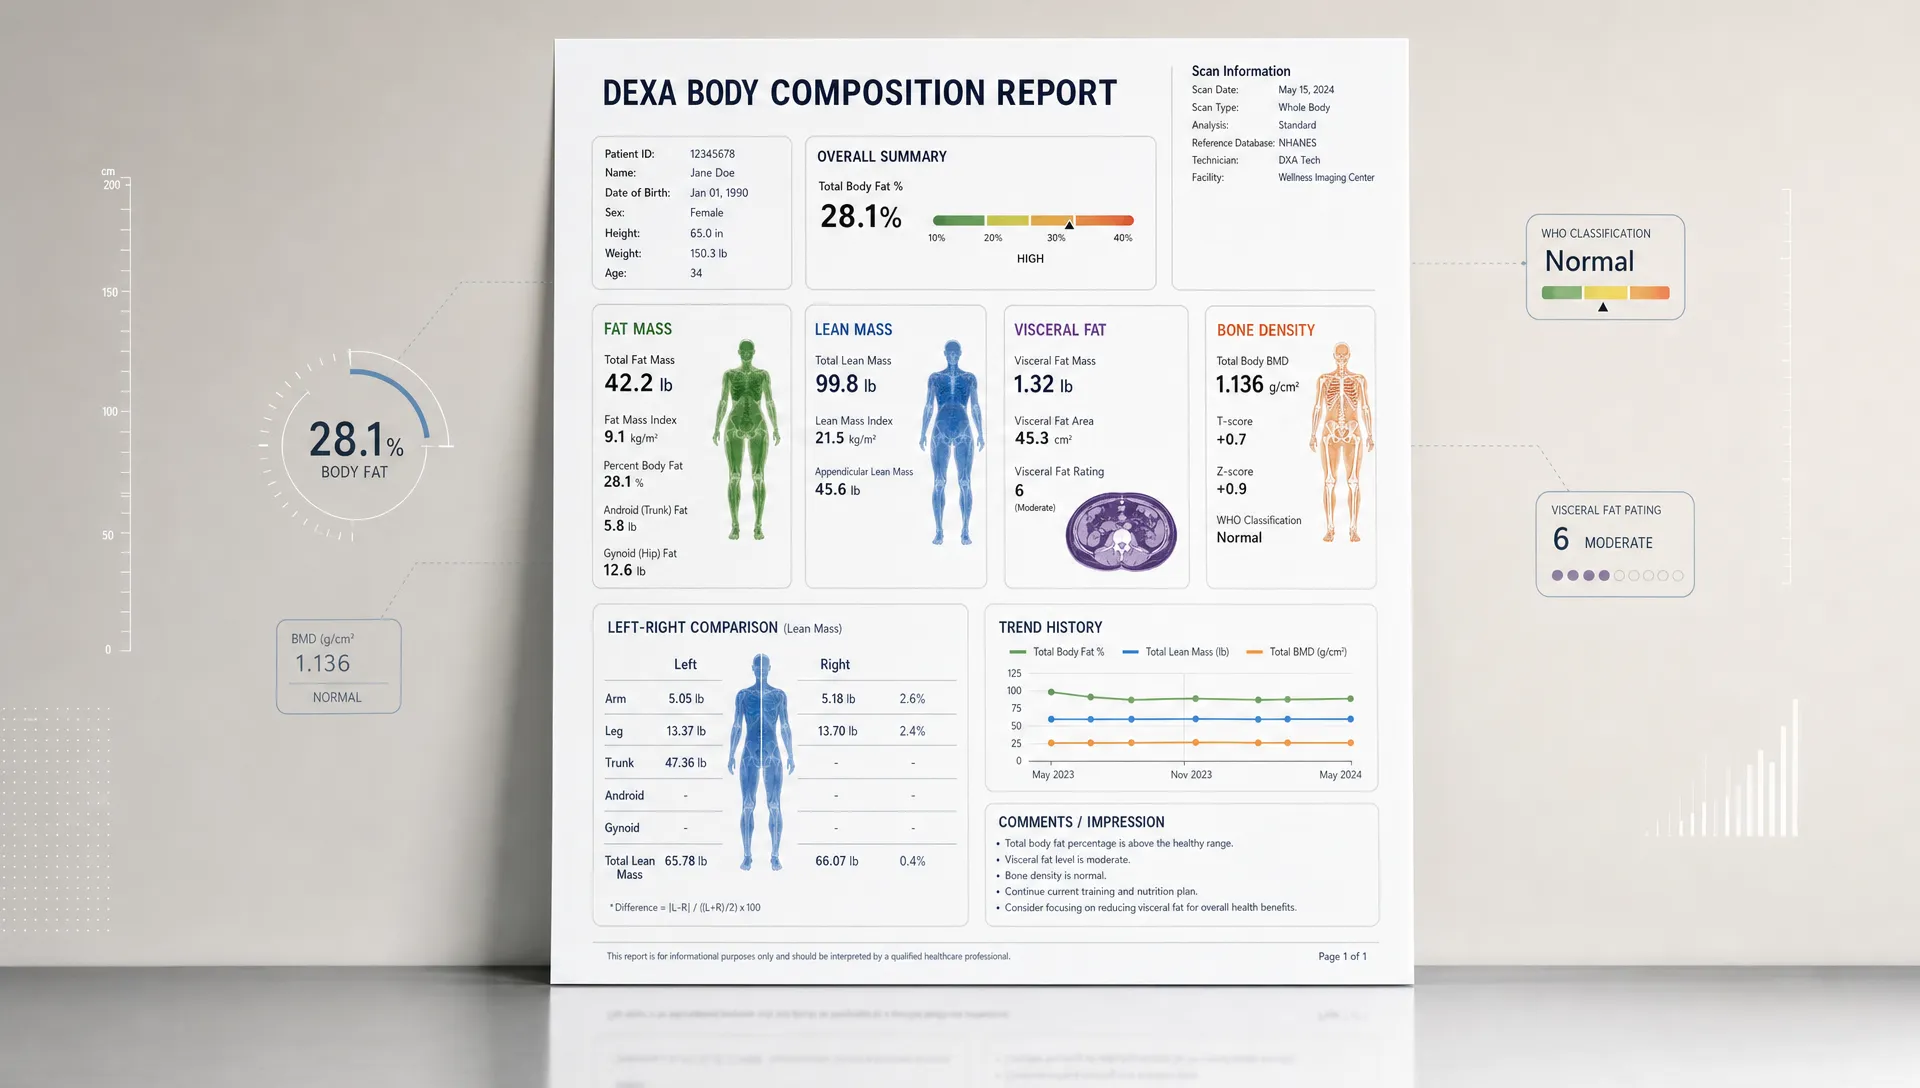
A DEXA report can feel like a wall of numbers at first glance. You may see body fat percentage, fat mass, lean mass, visceral fat, bone mineral density, left and right side comparisons, and estimated metabolic metrics, all on the same document. Good DEXA scan interpretation is not about finding one perfect number. It is about understanding what each metric means, how the metrics relate to each other, and which changes matter for your goals.
This guide walks through a practical way to read your report, from the big-picture totals to the regional details that help guide training, nutrition, and long-term health decisions.
Start with what your DEXA report is designed to tell you
DEXA, also called DXA, uses low-dose X-ray technology to estimate different tissues in the body. In a body composition report, the scan typically separates your body into fat mass, lean mass, and bone mineral content. Depending on the report format, it may also show visceral fat, regional fat distribution, left versus right asymmetries, and bone density metrics.
The biggest advantage of DEXA is that it moves beyond scale weight. A scale cannot tell you whether a 5-pound change came from fat, muscle, water, or a combination. A DEXA report gives more context by showing what changed and where.
That said, your report is still a snapshot. It should be interpreted alongside your goals, training history, nutrition, medical background, and previous scan results when available. One scan can establish a baseline. Multiple scans, done under similar conditions, show the trend.
The core DEXA report sections at a glance
| Report metric | What it generally means | How to use it |
|---|---|---|
| Total mass | Your total measured body mass at the time of the scan | Use as context, not the main success metric |
| Fat mass | The estimated pounds or kilograms of fat tissue | Track fat loss or fat gain directly |
| Body fat percentage | The percentage of total mass that is fat | Useful, but affected by changes in lean mass too |
| Lean mass | Non-fat, non-bone soft tissue, including muscle, water, organs, and connective tissue | Track muscle-building progress with caution and context |
| Bone mineral content | Estimated mineral content in bone | Useful for body composition context |
| Bone mineral density | Bone mineral content divided by bone area, when reported | Used for bone health assessment, especially with T-scores and Z-scores |
| Visceral fat | Fat stored deeper in the abdomen around internal organs | Useful for metabolic health risk context |
| Regional analysis | Fat and lean mass by body region | Helps identify distribution patterns and asymmetries |
| Estimated metabolic data | Calculated estimates such as resting metabolic rate, if included | Helpful for planning, but not the same as direct metabolic testing |
Step 1: Read total body composition before focusing on one score
Many people jump straight to body fat percentage. That number matters, but it can mislead you if you read it in isolation. Start with the total picture: total mass, fat mass, lean mass, and bone-related metrics.
For example, if your weight stayed the same but fat mass went down and lean mass went up, your body composition improved even though the scale did not move. If your weight dropped quickly but lean mass dropped too, the report may suggest that your nutrition, recovery, or resistance training plan needs adjustment.
A practical DEXA scan interpretation starts with this question: what changed, and what tissue explains the change?
| What changed between scans | Possible interpretation | What to review next |
|---|---|---|
| Weight down, fat mass down, lean mass stable | Likely successful fat loss while preserving lean tissue | Continue monitoring protein intake, training, and recovery |
| Weight same, fat mass down, lean mass up | Body recomposition | Keep tracking performance and regional lean mass |
| Weight down, lean mass down significantly | Possible under-fueling, low protein, low resistance training, or recovery issue | Review diet, training load, sleep, and scan conditions |
| Weight up, lean mass up, fat mass stable | Possible muscle gain or increased lean tissue | Compare strength, training phase, and hydration consistency |
| Body fat percentage down, fat mass unchanged | Lean mass may have increased, changing the percentage | Look at absolute fat mass and lean mass, not percentage alone |
This is why absolute numbers matter. Body fat percentage is a ratio. Fat mass and lean mass show the actual tissue estimates behind that ratio.
Step 2: Interpret body fat metrics in context
Your report may show total body fat percentage, total fat mass, and regional fat. Each tells a different part of the story.
Body fat percentage is often the most familiar number, but it is not always the most actionable. If you gain lean mass, your body fat percentage can decrease even if fat mass stays the same. If you lose lean mass, your body fat percentage can increase even without gaining much fat. For progress tracking, fat mass in pounds or kilograms often gives a cleaner read.
Regional fat can be just as important. DEXA reports often separate trunk, arms, legs, and sometimes android and gynoid regions. The android region is around the abdomen, while the gynoid region is around the hips and thighs. A higher concentration of abdominal fat can be more relevant to metabolic health than total body fat alone.
Visceral fat deserves special attention. It is stored deeper inside the abdomen around organs, not just under the skin. Research and clinical guidance consistently associate excess abdominal and visceral fat with cardiometabolic risk. Harvard Health summarizes why abdominal fat is more metabolically active than fat in some other regions, which is why many people track it separately from total fat.
If body fat is your main concern, it helps to look at the full fat section rather than only the headline percentage. For a more focused walkthrough, DEXA SF has a detailed guide on how to read DEXA scan body fat results.
Step 3: Understand lean mass without confusing it with pure muscle
Lean mass is one of the most useful parts of a DEXA report, but it is also one of the easiest to overinterpret. In a DEXA body composition report, lean mass generally means non-fat, non-bone soft tissue. That includes skeletal muscle, but it also includes water, organs, connective tissue, and other lean tissues.
This matters because a change in lean mass is not automatically the same thing as a change in contractile muscle tissue. Hydration status, glycogen storage, recent training, inflammation, and meal timing can all influence lean mass readings. If you scan after a hard workout, after travel, or under very different hydration conditions, the comparison may be less clean.
Still, lean mass is extremely valuable when interpreted consistently. Athletes may track arm and leg lean mass to assess training response. People pursuing fat loss may use lean mass to confirm that they are preserving tissue while losing fat. People rebuilding after inactivity may watch for gradual increases over time.
Pay attention to appendicular lean mass if your report includes it. This usually refers to lean mass in the arms and legs and can be a useful proxy for skeletal muscle trends. It is especially helpful when paired with performance markers such as strength, walking speed, balance, or sport-specific output.
Step 4: Use regional data to spot distribution and asymmetry
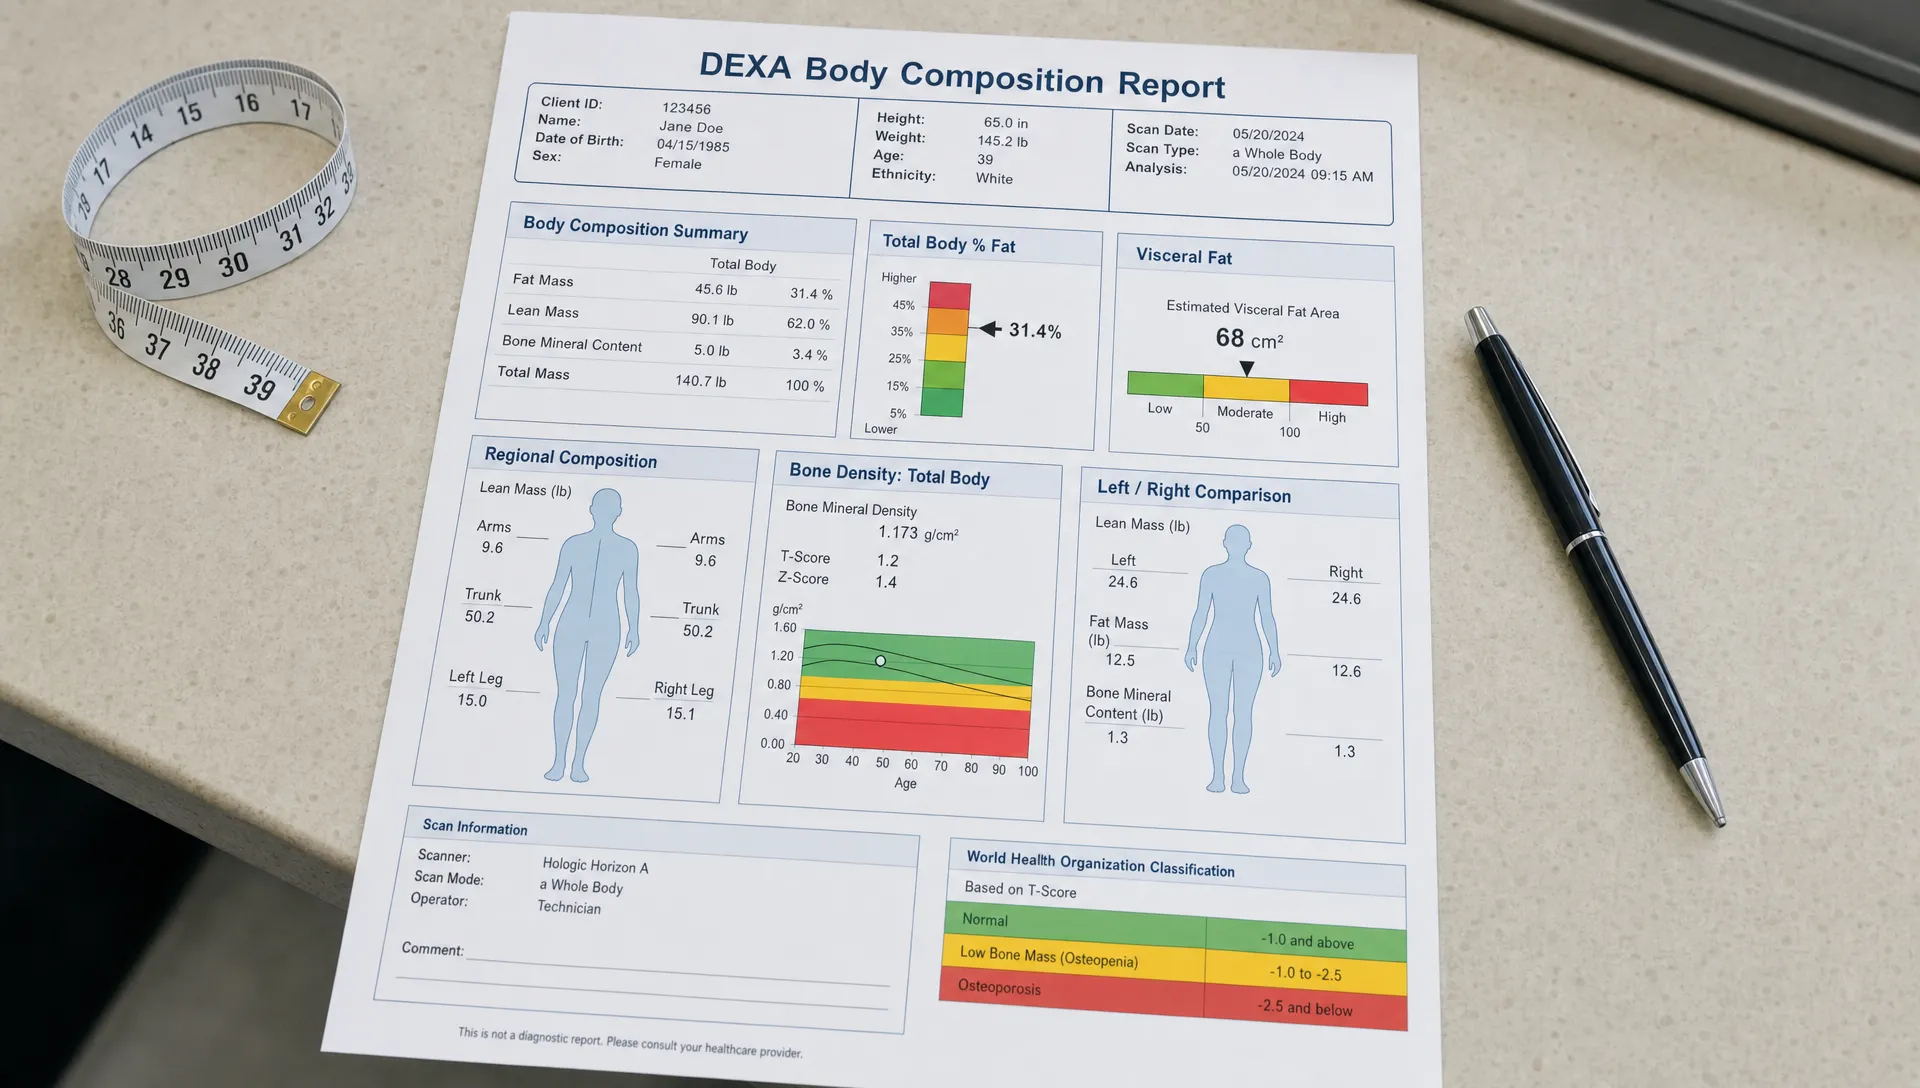
One of the most useful parts of a DEXA report is the regional breakdown. Instead of giving only total body numbers, DEXA can estimate tissue distribution across the trunk, arms, legs, and left and right sides.
This is useful because two people can have the same total body fat percentage but very different fat distribution. One person may carry more fat in the trunk and abdomen, while another may carry more in the hips and legs. Similarly, two people may have the same total lean mass, but one may have a meaningful left-right imbalance from sport, injury history, or training habits.
Small asymmetries are common. Humans are not perfectly symmetrical. A right-handed person may have slightly more lean mass on the right side, and athletes in rotational sports may show sport-specific differences. The key is not to panic over every difference. Instead, look for larger, persistent asymmetries that match your movement history, injury history, or performance gaps.
| Regional section | What it can help reveal | Practical use |
|---|---|---|
| Trunk fat | Central fat storage | Useful for metabolic health and fat-loss tracking |
| Leg lean mass | Lower-body lean tissue distribution | Helpful for strength, performance, and aging-related goals |
| Arm lean mass | Upper-body lean tissue distribution | Useful for resistance training progress |
| Left versus right lean mass | Side-to-side differences | Can guide unilateral training or discussion with a coach or clinician |
| Android/gynoid ratio | Abdominal versus hip/thigh fat distribution | Adds context beyond total body fat percentage |
If your report shows an asymmetry, use it as a clue, not a diagnosis. A DEXA scan does not tell you why the asymmetry exists. It can help you ask better questions about training balance, rehabilitation, mobility, and sport-specific loading.
Step 5: Know what bone density numbers can and cannot say
DEXA technology is widely used for bone density assessment. If your report includes bone mineral density, T-scores, or Z-scores, these values require careful interpretation.
A T-score compares your bone density with that of a healthy young adult reference population. A Z-score compares your bone density with what is expected for someone of your age, sex, and body size. In clinical settings, T-scores are commonly used in osteoporosis classification for postmenopausal women and men age 50 and older. Z-scores are often more relevant for younger adults.
The International Society for Clinical Densitometry provides detailed official positions for bone density testing and interpretation, including how results should be reported and when follow-up may be appropriate. The NIH also explains that osteoporosis is a condition in which bones become weaker and more likely to fracture, and it provides patient-friendly information on osteoporosis and bone health.
For a fitness-focused body composition scan, bone metrics can be useful context, but concerning bone density findings should be discussed with a qualified healthcare professional. Nutrition, resistance training, vitamin D status, calcium intake, medications, hormonal status, and medical history can all influence bone health.
Step 6: Compare scans correctly over time
A single DEXA scan gives you a baseline. The real value often comes from comparing scans over time. But comparisons only work well when the scans are performed consistently.
Try to keep conditions similar from scan to scan. Scan at a similar time of day when possible. Avoid comparing a scan done after a heavy training session with one done after several rest days. Keep hydration, meal timing, and clothing similar. Use the same facility and scanner when you can, because different machines and software versions may produce slightly different estimates.
Small changes may not be meaningful. Every measurement tool has normal variability. In bone density testing, clinicians use concepts such as precision error and least significant change to decide whether a difference is likely real. The same general idea applies to body composition: do not overreact to tiny shifts, especially if scan conditions were different.
For body composition goals, many people find it useful to repeat scans after enough time has passed for a meaningful change to occur. That might be after a focused training block, a nutrition phase, or a period of lifestyle change. If you are deciding which metrics deserve the most attention, this DEXA SF article on which DEXA results you should track can help you prioritize.
If timing is your main question, DEXA SF also covers benefits, cost considerations, and scan frequency in its DEXA scan guide for 2026.
A sample DEXA scan interpretation walkthrough
Imagine someone gets a baseline scan and then returns after 12 weeks of consistent resistance training, higher protein intake, and moderate calorie control. The scale shows only a 2-pound drop. At first, that might feel disappointing. The DEXA comparison tells a different story.
| Metric | Baseline | Follow-up | Interpretation |
|---|---|---|---|
| Total weight | 180 lb | 178 lb | Small scale decrease |
| Fat mass | 54 lb | 48 lb | 6 lb fat loss |
| Lean mass | 121 lb | 125 lb | 4 lb lean mass increase |
| Body fat percentage | 30% | 27% | Improved ratio due to fat loss and lean gain |
| Visceral fat | Higher baseline value | Lower follow-up value | Positive metabolic health direction |
The scale changed by only 2 pounds, but the body composition changed meaningfully. This is one of the main reasons people use DEXA. It can reveal progress that is invisible on a bathroom scale.
Now imagine a different case. Someone loses 12 pounds, but the report shows 7 pounds of fat loss and 5 pounds of lean mass loss. That may still represent progress, but it raises a different question: was the calorie deficit too aggressive, was protein too low, was resistance training missing, or were scan conditions inconsistent?
The point is not to judge the result as good or bad in isolation. The point is to use the report to make a better next decision.
Turning your report into next steps
Once you understand the report, the next step is action. The right action depends on your goal.
If your goal is fat loss, focus less on body weight and more on fat mass, visceral fat, and lean mass preservation. A strong plan usually includes a sustainable calorie deficit, sufficient protein, resistance training, regular movement, and sleep consistency.
If your goal is muscle gain, track lean mass by region, but pair it with performance data. Are your lifts improving? Are you recovering well? Are you eating enough to support training? DEXA can show tissue trends, but strength and performance help confirm whether the plan is working.
If your goal is bone health, pay attention to bone density metrics when included and discuss concerning results with a clinician. Resistance training, impact or weight-bearing activity when appropriate, adequate nutrition, and medical evaluation can all matter.
If your goal is metabolic health, do not stop at total body fat percentage. Look at trunk fat, visceral fat, waist measurements, blood pressure, blood lipids, glucose markers, and family history. DEXA gives valuable body composition data, but metabolic health is broader than any single scan.
At DEXA SF, the goal is not only to produce a scan, but to help you understand what the numbers mean. A professional DEXA body composition scan in San Francisco can provide precise measurements of body fat, lean mass, bone density, visceral fat, asymmetry, and metabolic data, with expert interpretation and personalized fitness and nutrition guidance.
Common DEXA scan interpretation mistakes
The most common mistake is treating body fat percentage like a final grade. It is one useful metric, not a complete health profile. A lower number is not automatically better for every person, especially if performance, hormones, energy, or recovery suffer.
Another mistake is comparing your results too closely with someone else’s. Age, sex, genetics, training history, sport, medical background, and goals all affect what your numbers mean. Your best comparison is usually your own prior scan.
People also overreact to small changes. A minor shift in lean mass or fat mass may reflect normal measurement variation or different scan conditions. Look for patterns over time.
Finally, many people forget to connect the report to behavior. The report is useful because it helps guide decisions. If the scan shows declining lean mass, review training and protein. If visceral fat is high, review nutrition, activity, sleep, stress, and clinical risk markers. If asymmetry is notable, consider unilateral training or professional movement assessment.
Frequently Asked Questions
What is the most important number on a DEXA report? There is no single most important number for everyone. Fat mass, lean mass, visceral fat, regional distribution, and bone metrics all matter differently depending on your goal. For progress tracking, absolute fat mass and lean mass are often more useful than body fat percentage alone.
Is DEXA body fat percentage more useful than BMI? DEXA body fat percentage gives more detail than BMI because it separates fat mass from lean mass and bone-related measurements. BMI can be useful for population-level screening, but it does not show what your weight is made of.
Does lean mass mean muscle mass? Not exactly. Lean mass includes muscle, but it also includes water, organs, connective tissue, and other non-fat soft tissues. Changes in lean mass should be interpreted with hydration, training, and scan conditions in mind.
How often should I get a DEXA scan? It depends on your goal. For fitness and body composition tracking, it usually makes sense to wait long enough for your training or nutrition plan to create measurable change. For medical bone density monitoring, follow your clinician’s recommendation.
Can a DEXA scan diagnose health conditions? A DEXA scan can provide clinically useful information, especially for bone density assessment, but diagnosis should come from a qualified healthcare professional who can interpret the scan with your medical history, labs, symptoms, and risk factors.
Why did my body fat percentage change if my fat mass did not? Body fat percentage is a ratio. If your lean mass changes, your percentage can change even when fat mass is stable. Always compare body fat percentage with absolute fat mass and lean mass.
Ready to understand your numbers with confidence?
A DEXA report is most valuable when you know how to turn the data into a plan. If you want a precise baseline or a clearer way to track progress, DEXA SF provides professional DEXA body composition scans in San Francisco with expert interpretation, fitness guidance, and nutrition advice.
Schedule a scan, bring your questions, and use your report as a practical roadmap for better decisions about training, nutrition, body composition, and long-term health.