
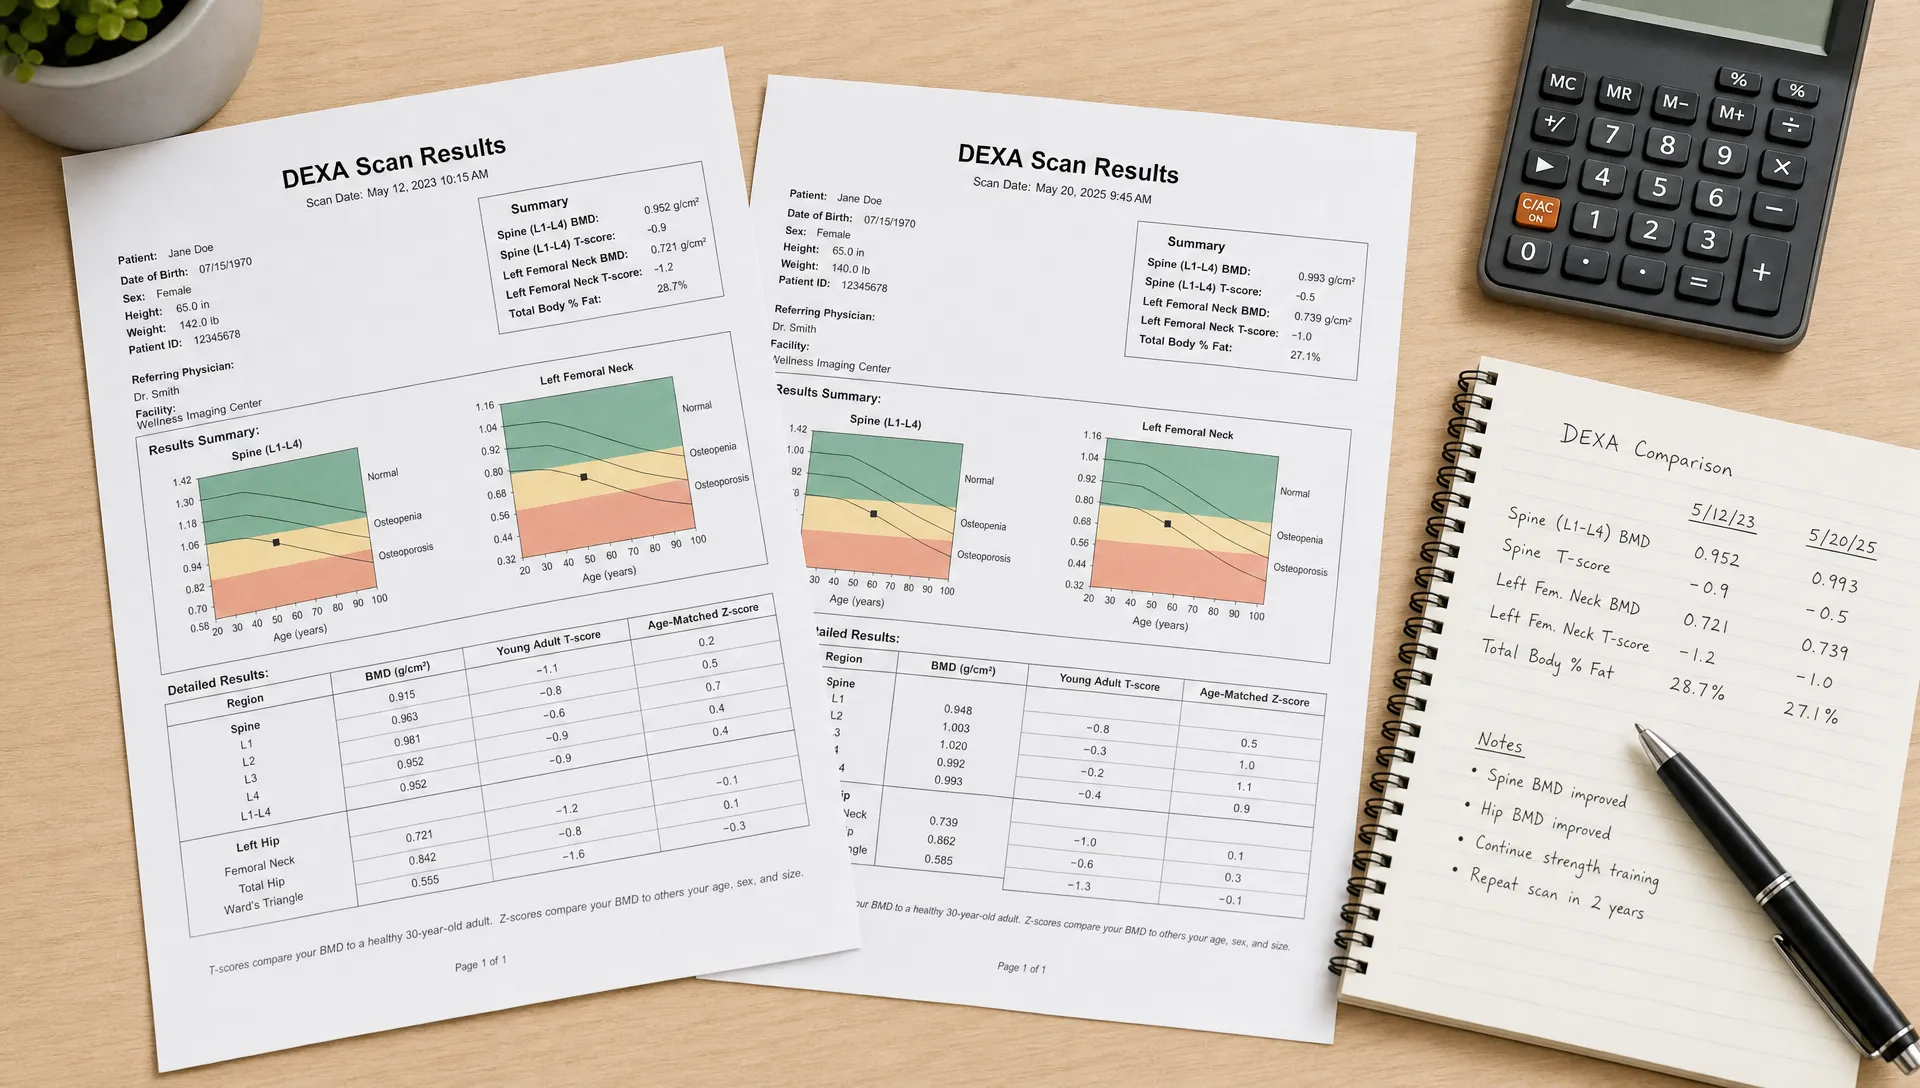
How to Compare DEXA Analysis Results Between Scans
A DEXA scan becomes most valuable when you treat it as a repeatable measurement system. One scan gives you a baseline. Two or more scans show whether your training, nutrition, recovery and lifestyle are moving your body composition in the direction you intended.
The tricky part is that comparing DEXA analysis results is not as simple as looking at whether your body fat percentage went up or down. You need to compare the right metrics, under similar testing conditions, across a realistic time frame. Otherwise, a normal measurement fluctuation can look like progress or a meaningful change can be hidden behind a single headline number.
This guide walks through a practical way to compare DEXA results between scans so you can separate signal from noise and make better decisions after each appointment.
Start with the same goal for both scans
Before you open your reports side by side, clarify what you were trying to change between scan dates. The right comparison depends on the goal.
If your main goal was fat loss, body fat percentage matters, but fat mass, visceral fat and lean mass preservation matter more. If your goal was muscle gain, total lean mass is useful, but regional lean mass and left-right differences can reveal whether your program is producing balanced development. If your goal was bone health, bone mineral density should be evaluated more cautiously and usually over a longer time frame.
A good scan comparison starts with one question: “What outcome was I actually trying to influence?” From there, you can focus on the metrics that answer that question instead of reacting to every number on the page.
If you are still learning what each field on your report means, it can help to review a full DEXA scan interpretation guide before comparing multiple reports.
Make sure the scans are comparable
DEXA is precise, but repeatability still depends on testing conditions. A scan done after a salty meal, a hard leg day or unusual travel week may not line up perfectly with a scan done under calmer conditions.
For the cleanest comparison, try to keep these variables as consistent as possible:
- Time of day, especially if your weight fluctuates noticeably from morning to evening
- Food and fluid intake before the scan
- Alcohol intake and unusually high sodium intake in the prior day or two
- Hard training within 24 hours, especially heavy lifting or long endurance sessions
- Clothing, jewelry and items in pockets
- Scan location, equipment and positioning protocol
- Menstrual cycle timing, if it meaningfully affects water retention for you
This does not mean a scan is useless if conditions were not perfect. It means context belongs next to the numbers. If your second scan followed a heavy training block, higher carbohydrate intake and sore muscles, a small lean mass increase may partly reflect glycogen and water rather than new contractile tissue.
Compare absolute change before percentage change
Body fat percentage is useful, but it is a ratio. It can move because fat mass changed, lean mass changed or both changed at once. That is why absolute changes usually tell the clearer story.
For example, a drop from 25% to 23% body fat sounds straightforward, but the meaning depends on what happened underneath. You may have lost fat while keeping lean mass stable, which is usually a strong result for a fat loss phase. You may also have lost both fat and lean mass, which requires a different response.
Use your DEXA report to compare pounds or kilograms of fat mass and lean mass, not just percentages. Then use body fat percentage as a summary metric.
| Metric | What to compare first | Why it matters | Common mistake |
|---|---|---|---|
| Body fat percentage | Percentage point change | Shows the proportion of fat relative to total mass | Treating it as the whole story |
| Fat mass | Pounds or kilograms gained or lost | Shows actual fat tissue change | Ignoring it when scale weight is stable |
| Lean mass | Pounds or kilograms gained or lost | Helps assess muscle retention or gain | Assuming every lean mass change is muscle |
| Visceral fat | Area or volume, depending on report | Tracks abdominal fat around organs | Comparing it without enough time between scans |
| Regional lean mass | Arms, legs and trunk | Shows where changes happened | Only looking at total lean mass |
| Left-right difference | Side-to-side comparison | Highlights asymmetry trends | Overreacting to tiny differences |
| Bone density | BMD, T-score or Z-score if reported | Monitors skeletal health | Expecting fast short-term changes |
Use a simple scan-to-scan calculation
Once the reports are side by side, calculate the change for each key metric.
The formula is simple:
Scan 2 value minus Scan 1 value equals change.
If your fat mass was 48.0 pounds on the first scan and 43.5 pounds on the second scan, your change is minus 4.5 pounds of fat mass. If your lean mass went from 121.0 to 122.2 pounds, your change is plus 1.2 pounds of lean mass.
Then add the time frame. A 4.5 pound fat mass drop over 16 weeks has a different implication than the same change over 4 weeks. Rate of change helps you decide whether your current approach is sustainable or too aggressive.
Here is a simplified comparison format you can use outside your full report:
| Metric | Scan 1 | Scan 2 | Change | Practical read |
|---|---|---|---|---|
| Body weight | 180.0 lb | 177.5 lb | -2.5 lb | Scale moved modestly |
| Body fat percentage | 25.0% | 22.8% | -2.2 points | Body composition improved |
| Fat mass | 45.0 lb | 40.5 lb | -4.5 lb | Meaningful fat loss trend |
| Lean mass | 128.0 lb | 129.7 lb | +1.7 lb | Lean mass preserved or increased |
| Visceral fat | 1.2 lb | 1.0 lb | -0.2 lb | Directionally favorable |
The exact metrics and units on your report may differ, so use the fields shown by your DEXA provider. The principle is the same: compare the component parts before drawing conclusions from the headline number.
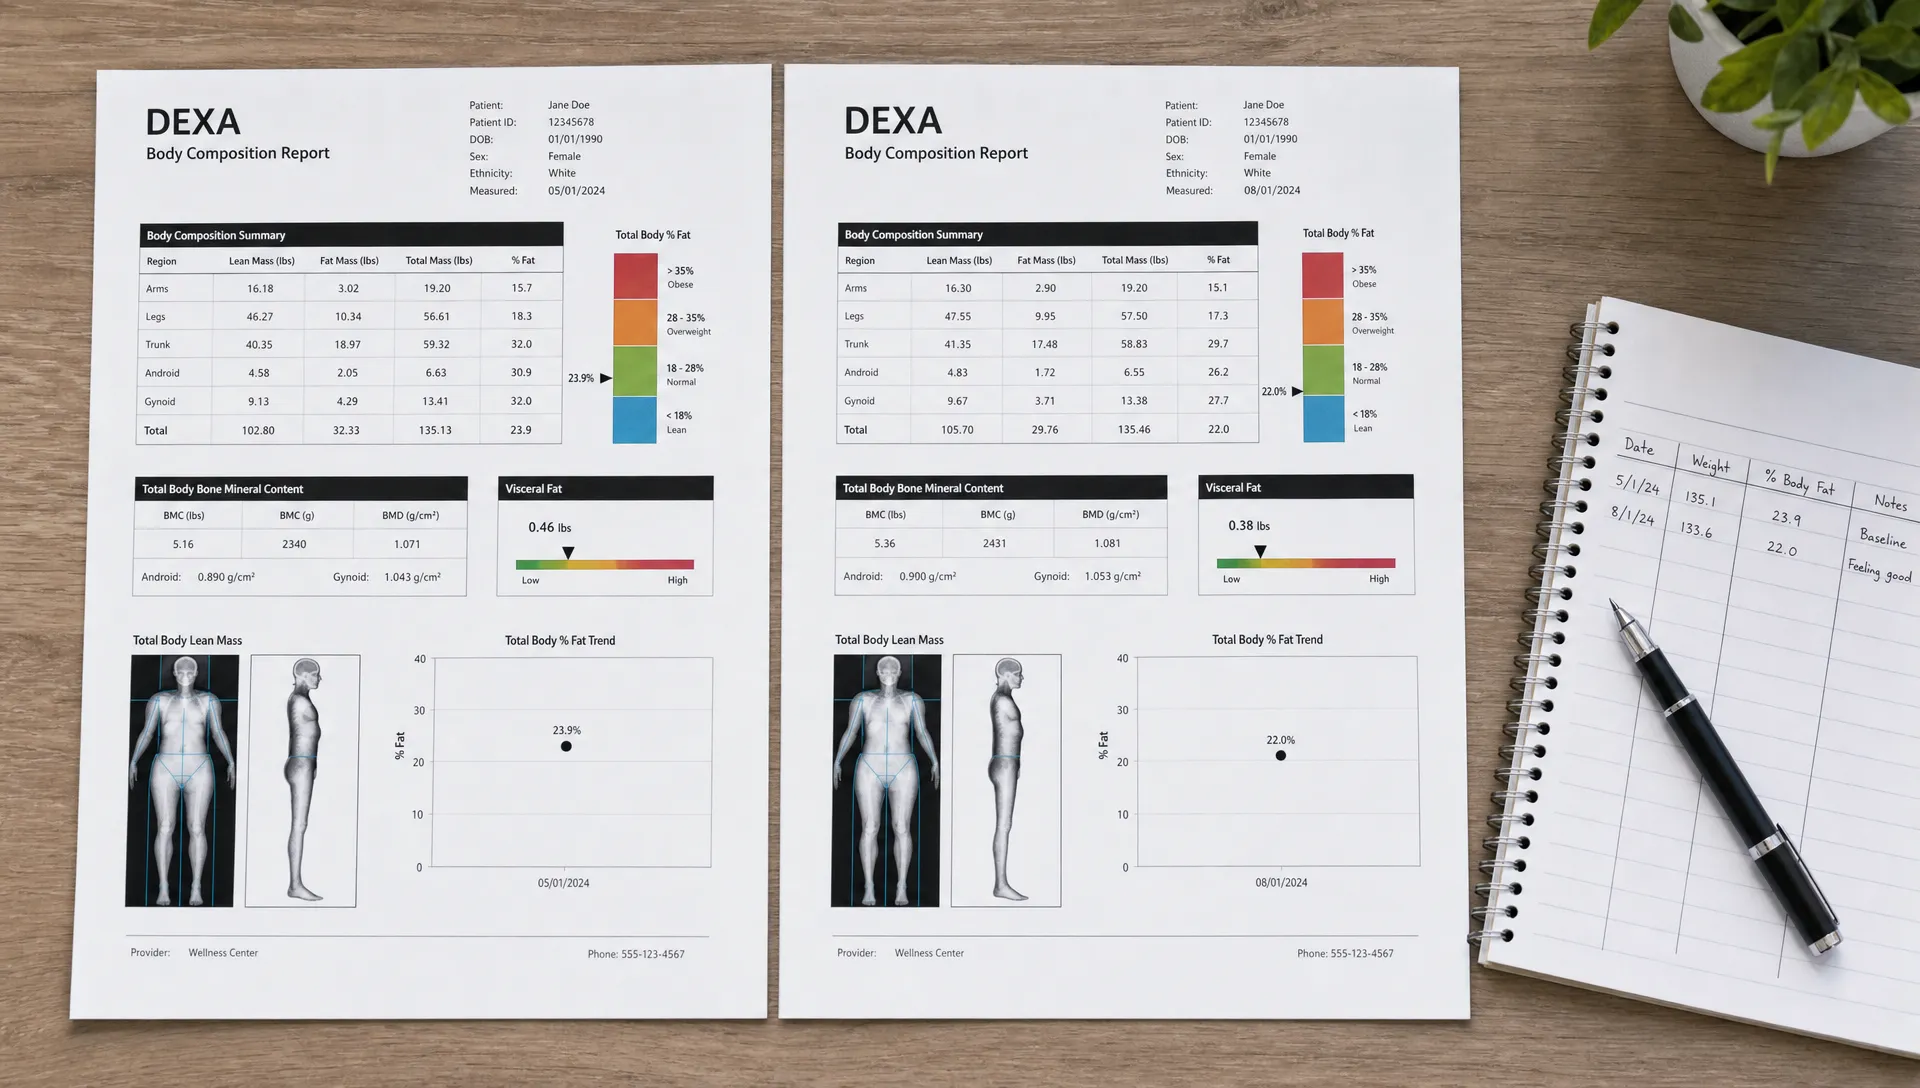
Read body recomposition correctly
Body recomposition means losing fat and gaining or preserving lean mass at the same time. It is one of the main reasons DEXA can be more useful than a bathroom scale.
If the scale barely changes, you may assume your plan is not working. A DEXA comparison can show that you lost fat mass while gaining lean mass, which means the scale masked progress. This is common when someone starts resistance training, increases protein intake or returns to training after time off.
A recomposition pattern may look like this:
| Pattern | Fat mass | Lean mass | Scale weight | Likely interpretation |
|---|---|---|---|---|
| Fat loss phase going well | Down | Stable or slightly up | Down | Strong result |
| Recomposition | Down | Up | Stable | Scale hides progress |
| Diet too aggressive | Down | Down | Down | Review calories, protein and training |
| Mass gain phase | Up slightly | Up more | Up | May be acceptable if lean gain is the goal |
| Poor training response | Stable or up | Stable | Stable or up | Review program consistency and nutrition |
This is where DEXA analysis results become actionable. Instead of asking whether weight changed, you can ask what type of weight changed.
For a deeper look at lean mass tracking, see how a DEXA scan tracks muscle mass progress across total and regional measurements.
Separate lean mass from muscle gain
DEXA reports lean mass, not pure muscle tissue. Lean mass includes muscle, water, organs, connective tissue and other non-fat, non-bone components. That distinction matters when you compare scans.
A short-term increase in lean mass can be influenced by training inflammation, glycogen storage, hydration and recent carbohydrate intake. For example, if you trained hard the day before your scan, your legs may hold extra fluid. The report may show a regional lean mass increase that is real from a measurement standpoint, but not necessarily a permanent increase in muscle tissue.
This is why repeat patterns matter. If lean mass is higher across several scans and your strength, training volume and measurements support the same trend, it is more convincing. If lean mass spikes after a hard training week and then normalizes later, it may have been partly fluid-related.
Pay attention to regional changes
Total body metrics are helpful, but regional results often explain why your total changed. DEXA can break down composition by areas such as arms, legs and trunk. This is useful for athletes, lifters, people returning from injury and anyone trying to correct imbalances.
When comparing regional results, look for directional patterns rather than tiny differences. A small change in one arm may not matter. A repeated pattern where one leg carries less lean mass than the other may be worth discussing with a trainer, physical therapist or qualified clinician, depending on your history and symptoms.
Regional comparisons are especially useful when your training has a specific emphasis. If you added two lower-body strength sessions per week, you would expect changes to show more clearly in the legs over time than in the arms. If your trunk fat mass is decreasing but limb lean mass is stable, your plan may be supporting fat loss without sacrificing muscle.
Compare visceral fat carefully
Visceral fat is the fat stored deeper in the abdomen around internal organs. It is different from subcutaneous fat, which sits under the skin. DEXA can estimate visceral fat, making it a valuable metric to follow when health risk reduction is one of your goals.
Do not expect visceral fat to change dramatically from week to week. It is better compared across longer intervals and alongside other context such as waist measurement, nutrition consistency, activity level and overall fat mass trend.
A favorable pattern is usually a reduction in visceral fat along with a reduction in total fat mass or trunk fat mass. If body weight drops but visceral fat does not move much, that does not automatically mean failure. It may mean you need more time or that most of the change so far occurred elsewhere.
Treat bone density as a longer-term metric
Bone metrics should not be interpreted the same way as body fat or lean mass. Bone mineral density changes slowly, and small scan-to-scan differences may reflect normal measurement variability.
The International Society for Clinical Densitometry emphasizes the use of precision assessment and least significant change when monitoring bone mineral density over time. In plain English, a facility needs to know how much change is large enough to be considered real rather than normal testing variation. You can review the organization’s official positions through the International Society for Clinical Densitometry.
If your scan includes bone density information, use it as a tracking metric, not a self-diagnosis. Questions about osteoporosis, fracture risk, medication or medical treatment belong with a licensed healthcare professional. For fitness-oriented users, the main takeaway is that bone data is valuable, but it should be compared over appropriate time frames and interpreted with care.
Do not overreact to one scan
A single follow-up scan can confirm progress, raise questions or show that a plan needs adjustment. It should not cause panic.
Body composition is affected by training status, hydration, diet phase, sleep, stress, travel and consistency. A scan is a snapshot taken under specific conditions. The more consistent the conditions and the more data points you collect over time, the more useful the trend becomes.
A practical approach is to compare your current result to both your previous scan and your original baseline. Your previous scan shows short-term direction. Your baseline shows the bigger arc. Someone may have a flat month but still be down 12 pounds of fat mass across the year, which is a very different story than “no progress.”
Choose a realistic scan interval
The best interval depends on your goal and how quickly change is expected.
For active fat loss or muscle gain phases, many people find that scanning every few months gives enough time for meaningful change to appear. Scanning too frequently can create noise, especially if you are making decisions based on small differences. For bone density monitoring, the appropriate interval may be longer and should be guided by medical context when relevant.
Use shorter intervals only when you have a specific reason, such as a tightly controlled training block, a competition prep timeline or a nutrition intervention you want to evaluate. In most cases, a scan schedule should support better decisions, not create more anxiety.
If you are comparing body fat metrics specifically, this guide to reading DEXA scan body fat results can help you understand how percentage, fat mass and distribution fit together.
Turn the comparison into a decision
The goal of repeat scanning is not to collect numbers. It is to make a better next move.
After comparing your reports, summarize the result in one or two sentences. For example: “I lost fat mass while preserving lean mass, so the current plan is working.” Or: “Weight loss was mostly lean mass, so I need to reassess my calorie deficit, protein intake and strength training.”
Then choose one adjustment, not five. If fat loss stalled, you might improve meal consistency or increase daily activity. If lean mass dropped, you might review training intensity, recovery or protein. If asymmetry is widening, you might add unilateral work or ask a qualified professional to assess movement patterns.
DEXA SF provides DEXA body composition scans in San Francisco with measurements for body fat, lean mass, bone density, visceral fat, asymmetry and related metabolic insights. The scan itself is quick, and expert interpretation can help translate your report into fitness and nutrition guidance without guessing from the scale alone.
Frequently Asked Questions
What is the best way to compare DEXA analysis results between scans? Compare the same metrics under similar testing conditions, starting with absolute changes in fat mass, lean mass, visceral fat and regional values. Then use body fat percentage as a summary rather than the only measure of progress.
How much change between DEXA scans is meaningful? It depends on the metric, time between scans, testing consistency and the precision of the facility’s equipment and protocol. Larger changes across multiple related metrics are more convincing than tiny changes in a single number.
Should I compare body fat percentage or fat mass? Compare both, but start with fat mass. Body fat percentage can change because fat mass changed, lean mass changed or both changed. Fat mass tells you more directly whether actual fat tissue increased or decreased.
Can lean mass changes on DEXA be caused by water? Yes. DEXA lean mass includes water and other non-fat, non-bone tissue, so hydration, glycogen, training inflammation and recent exercise can influence short-term changes. Repeated trends are more useful than one isolated jump.
How often should I get a DEXA scan to track progress? For body composition goals, scanning every few months is often more useful than scanning very frequently because it gives your training and nutrition plan time to create measurable change. Bone density monitoring may require a longer interval and medical guidance.
Why did my scale weight stay the same while my DEXA results improved? You may have lost fat mass and gained or preserved lean mass at the same time. This is why DEXA can reveal progress that a scale misses, especially during resistance training or body recomposition phases.
Ready to compare your next scan with confidence?
If you want a clearer picture of what is changing in your body, schedule a professional DEXA scan with DEXA SF. You will get precise body composition measurements plus expert interpretation to help you understand your results and plan your next step.